This topic outlines the options available to configure for your Metric Widget on the Data Indexer (DX) dashboard.
To configure the Metric Widget’s settings:
-
Click the three-dot menu at the top-right of the widget.
-
Select Configure Widget.
The Widget Inspector appears at the right of your screen. -
Configure the following options as desired:
|
Option |
Description |
|---|---|
|
Title |
Choose how the title of the widget is generated:
|
|
Label |
Enter up to 500 characters to be used as a label below the value in the Metric Widget. In the following image, “Risk Score” is the label: 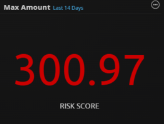
|
|
Field |
Select a metadata field for graph data. For more information, see Metadata Fields. |
|
Time Range |
Do one of the following:
If you previously set a custom time range in the Dashboard Time Range Filter, you must click Use Metric Widget’s Settings for the new widget settings to take effect. |
|
Widget Filter |
Use the Lucene Search Syntax to create a filter for the widget, and then select Apply Filter. |
|
Mode |
Change the values shown in the chart. Click in the field to select from:
|
|
Color |
Change the color of the text on the widget to reflect level of importance or to differentiate visually from other widgets. |
-
Click Save to save your settings for the widget.