-
Create a new Investigation with Platform Manager or Data Processor as the search type.
-
When the results appear, click the Network Visualization tab.
-
Do any of the following:
-
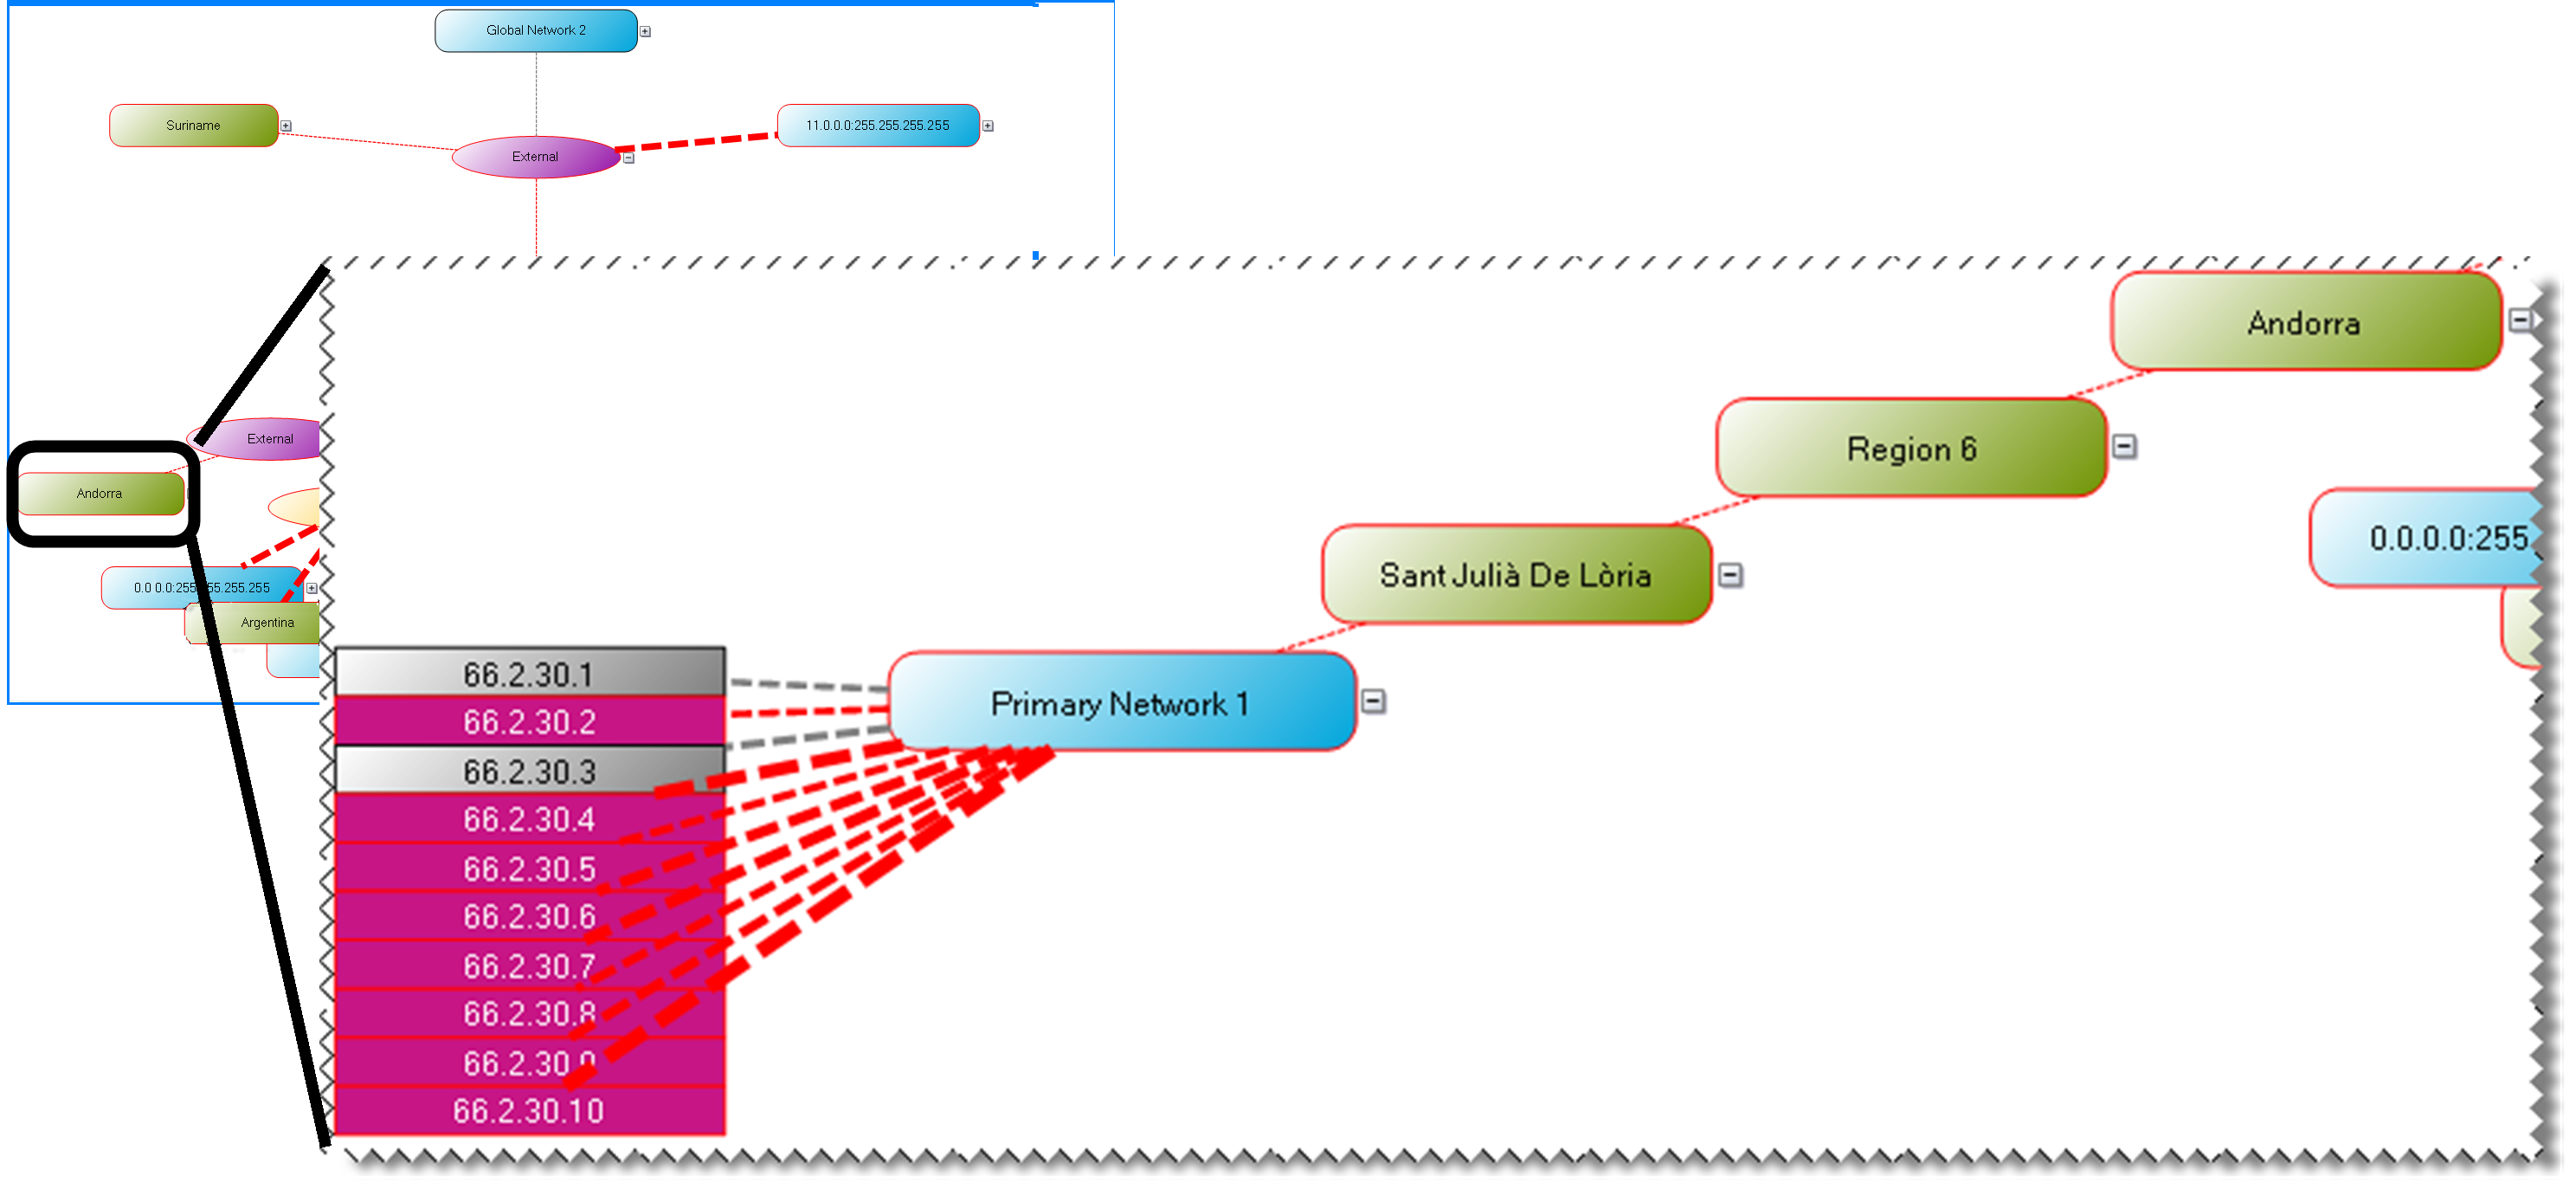
From the network visualization diagram
-
Click the + next to nodes to expand them.
-
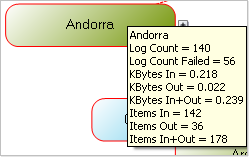
Point to a node to see a screen tip with additional information.
-
Click a Host to show connections to other Hosts and display detailed information in the left pane.
-
Arrows at the end of the lines indicate direction.
-
If a host is both the origin and destination, the line loops back to itself.
-
Red lines indicate the log failure count is greater than 0.
-
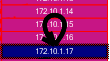
Briefly pause on a link to display a screen tip with statistics about the link.
-
Press Ctrl and click a link to display its statistics in the left pane.
-
-
Double-click a node to drill down and show logs where the node is either the origin or impacted host.
-
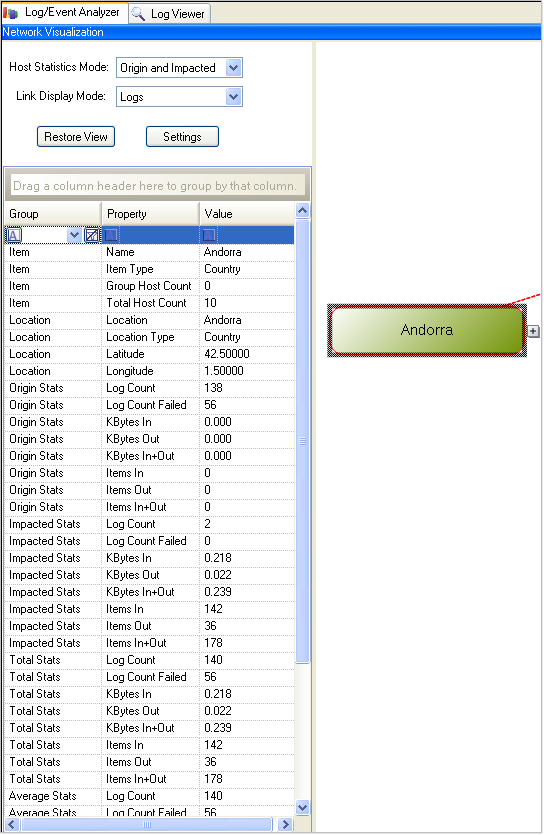
Click a node to view its statistics in the left pane.
-
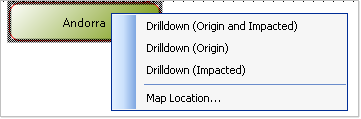
Right-click a selected node to display a context menu with the following options:
-
Drilldown (Origin and Impacted). Show logs that have the selected node is the origin or the impacted Host.
-
Drilldown (Origin). Show logs that have the selected node as the origin Host.
-
Drilldown (Impacted). Show logs that have the selected node as the impacted Host.
-
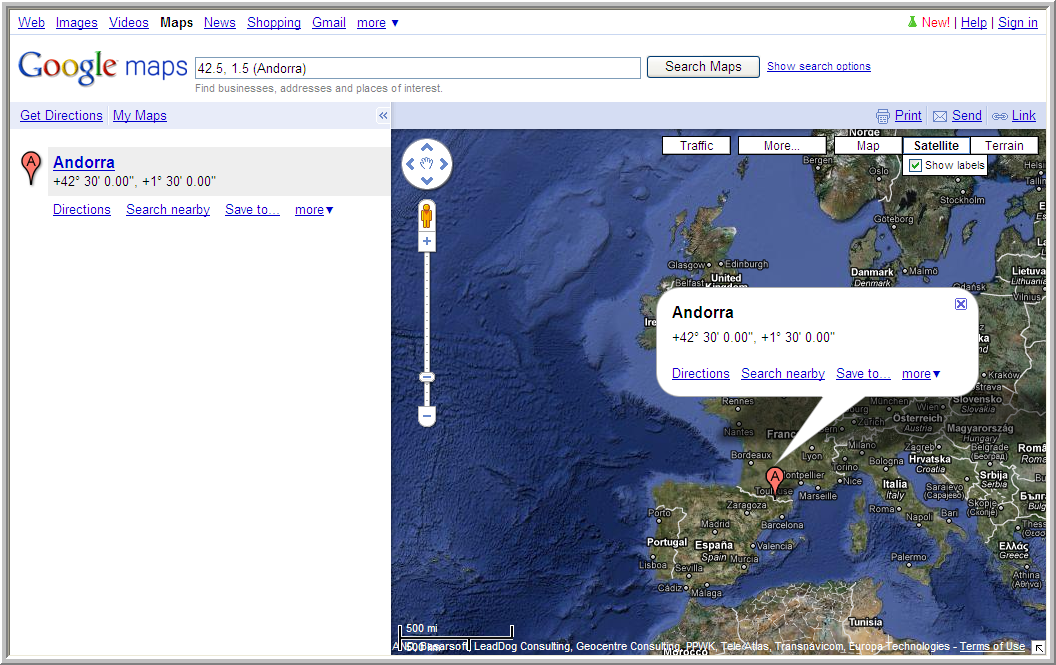
Map Location. If location information is available and you have access to a browser, select this option to display a map of a node location.
-
-
-
From the left pane of the network visualization tab
-
From the top of the left pane
-
Select a Host Statistics Mode. Set the diagram links and link display mode here. The options are:
-
Origin and Impacted (default)
-
Origin
-
Impacted
-
-
Link Display Mode. Set the diagram links and host statistics mode here. The options are:
-
Logs
-
Bytes In, or Bytes Out, or Bytes In +Out
-
Items In, or Items Out, or Items In + Out
-
-
Click Restore View to return the diagram to the default view.
-
Click Settings to display a window where you can:
-
Select which Group Levels to display.
-
Select Expand Levels and Zoom to fit in the default view. This setting only affects the default display. You can still expand/contract nodes and modify the zoom in the diagram.
-
-
From the middle of the left pane
-
Click a node to select it.
-
Click the root node to view statistics for the entire diagram.
-
Click the parent node to view statistics for all related child nodes.
-
-
From the bottom of the left pane
-
Slide the zoom control to increase or decrease the size of the diagram.
-
Move the rectangle around the thumbnail diagram to select the viewing area.
-
Click Fit to set the zoom and viewing area to display the entire diagram in one action.
-
-
-