Once Collectors and Pipelines have been setup in OC Admin, field mappings can be configured from the Pipelines List.
Mapping Actions
To view mapping actions, from the main page:
-
Click Pipelines in the menu bar.
-
Click the Open button next to the pipeline to be configured.
-
In the Mapping section, click the three-dot menu at the top-right.
The following actions are available:Action
Description
Edit Mapping
Refer to the
Add and Edit Fields Mapping
section for more information.
Download Mapping as JQ Pipeline
A file is downloaded containing the fields mapping.
Share and Import Mapping
Import a new OC Admin mapping file, or share one to the Marketplace.
Refer to the Share and Import Fields Mapping section for more information.
Delete Mapping
Remove the mapping from OC Admin. A prompt will confirm this action.
Add and Edit Fields Mapping
To add a new fields mapping or modify an existing one, from the Pipelines List:
-
Click the Open button next to the pipeline to be configured.
-
In the Mapping section, click the three-dot menu at the top-right.
-
Click Edit Mapping.
-
Click the Start Live Tail button in the navigation menu.
It may take up to a minute for the log data to load as it builds a configuration for a temporary shipper, starts the temporary shipper, and allows the shipper to collect data.
-
Review the fields and data structure of the incoming logs, and their respective frequencies.
The mini frequency graph can be hovered over to get full details.
These bars represent the following, from the top down:
Bar
Description
Relative Frequency
Shows the number of times this field has appeared in relation to the most common field.
For example, the most common field has a full bar, even if it only occurs in a small sub-set of the whole log sample.
A field showing about half as often as the most common field displays a 50% bar.
Absolute Frequency
Shows the number of times this field has appeared in the entire log sample.
When loading the field mapping from a pipeline configuration as opposed to running a live tail, the absolute frequency shows as N/A and the bar is full (as if it were 100%). This is because the full log sample is not saved as part of the field mapping, and there is no way to offer meaningful statistics.
-
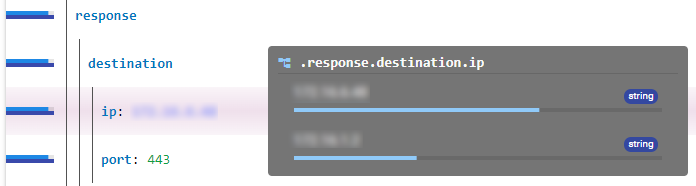
Roll over each field to display the variety of the values, their type, and their respective frequencies.
-
For each field of interest, pick a LogRhythm SIEM field from the Mapping drop-list.
This list is searchable by any word contained in the following:Searchable
Description
Field Name
The field name is displayed in bold at the top-left of each item in the list.
For example, Vendor Message ID.
Field Tag
The field tag is displayed in brackets on the top-right of each item in the list.
For example, <vmid>.
Field Description
The field description is displayed in gray at the bottom of each item.
For example, Specific vendor for the log used to describe a type of event.
-
(Optional.) Select one or more Modifier from the Modifiers drop-list.
-
Once the mapping is complete, click the Save button in the navigation bar.
Share and Import Fields Mapping
To share or import an already-existing fields mapping, from the Pipelines list:
-
Click the Open button next to the pipeline to be configured.
-
In the Mapping section, click the three-dot menu at the top-right.
-
Click Share and Import Mapping.
-
(Optional.) If you are sharing a fields mapping, toggle the following options as desired:
Option
Description
Share Field Frequencies
Include the frequency statistics for each field in your upload.
Share Field Values
Include all observed values in each field.
Ensure your file has been properly sanitized, as this option could lead to sharing personal information.
Refer to the Sanitization Options section below for more information.
Share Field SIEM Mapping
Include the SIEM tags mapping for each field in your upload.
Share Field Modifiers
Include the modifiers for each field in your upload.
-
Choose one of the following options:
Option
Description
Share as a Local File
Generate and download your already-configured fields mapping as an importable JSON OC Admin mapping file.
This file can then be imported in any other pipeline, either on the same OC Admin server or a different one.
Share via the Marketplace
Share your already-configured fields mapping with other OC Admin users as a pipeline template.
This allows any other OC Admin user to download it to complement an existing pipeline, or to create a new one from the template.
Refer to the Marketplace Considerations section below before sharing or downloading from the OC Admin Marketplace.
Import from Local File
Import a fields mapping using an OC Admin mapping file.
Import from Marketplace
Import a mapping that has been shared by another OC Admin user.
Sanitization Options
When sharing a fields mapping to the marketplace, you have the ability to sanitize the data so that personal information is not shared with third parties.
The following table shows the default sharing settings for the four major data points that could be sanitized when uploading a mapping. If you disable sharing for the data point, the third column shows how that information is replaced in the upload.
|
Sharing |
Default |
Exported value(s) if Sharing is Disabled |
|---|---|---|
|
Frequencies |
Enabled |
1 |
|
Values |
Disabled |
None (empty array) |
|
SIEM Mapping |
Enabled |
None |
|
Modifiers |
Enabled |
None |
Marketplace Considerations
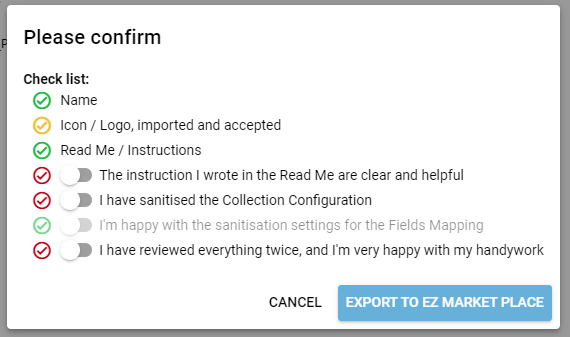
Before an upload to the online Marketplace occurs, you are prompted to:
-
Decide what to share (collection configuration only, fields mapping only, or both).
-
Ensure all configuration data has been sanitized and personal data has been removed.
-
When sharing a fields mapping, decide which part of the mapping should be shared (field frequencies, field SIEM mapping, field modifiers, etc.).
-
Provide a meaningful name for the file.
-
Provide a logo for the file.
-
Complete the Read Me, based on the provided template (this allows users to follow step-by-step instructions to use your template).
-
Click Export to EZ Marketplace.
Once a Pipeline Template has been uploaded, it is marked as Pending Review, and will not be downloadable by other users until it has successfully passed review from LogRhythm staff, at which point it is marked as Visible.
Mapping Settings
The Mapping Settings menu is located at the top-right of the Mapping window.
The following options are available in this menu:
|
Option |
Description |
|---|---|
|
Show types in Fields list |
Enable this toggle to display log source types in the Fields list during custom mappings. |
|
Show types in Value popups |
Enable this toggle to display log source types in Value pop-ups during custom mappings. |
|
Accept and Wrap non-JSON logs |
Enabling this toggle wraps any JSON data that is incorrectly formatted into a "fake" JSON field. With this option enabled, Open Collector is unable to process these incorrectly formatted logs. This option is best used to bypass the JSON format verification and view non-JSON data received from the shipper. |
|
Extract Beat's '.message' only |
Enabling this toggle is sometimes necessary for beats that wrap non-JSON data in a .message JSON entry. For example, the jsBeat and the FileBeat. This option needs to be enabled before processing incoming logs. |
|
Background Process (first slider) |
Move the slider left (slower) to right (faster) to determine how quickly incoming logs are processed by the OC Admin client. |
|
Max Messages in Queue (second slider) |
Move the slider left (fewer) to right (more) to determine the number of incoming messages to be accepted and queued for processing. When the set number of logs have been received, the live tail automatically stops. Any incoming logs in transit when the set number has been reached are ignored.
|
|
Max Messages in Processed Logs (third slider) |
Move the slider left (fewer) to right (more) to determine how many messages from the incoming queue will be processed. When the set number of logs have been processed, the background process automatically stops. Any logs still in the queue when the set number has been reached are left unprocessed.
|
Advanced Mapping Settings
The Advanced Mapping Settings menu is located at the top-right of the Mapping window, to the left of the Settings menu.
The following options are available in this menu:
|
Option |
Description |
|---|---|
|
Show extra details |
Enable this toggle to show extra details on mappings. |
|
Show Queues |
Enable this toggle to show the incoming log queues. |
|
Show Communication & Shipper's Logs |
Enable this toggle to display the log trail of the Shipper at the very bottom of the page. If no logs are coming in after starting the live tail, it's a good idea to look at the Shipper's logs and scout for any potential error messages, such as:
|
Manual Import of Log Samples
Some log samples can be imported into OC Admin manually. To manually import log samples, from the Mapping screen:
-
Click the Manual Import button in the navigation bar.
-
Select one of the following options:
Option
Description
Single Log
Accepts a single JSON object, representing a single log sample.
The following are examples of single log samples:
Compact format:
{"timestamp":"20210422T16:40:00","id":"abcdef-1234"}Spaced/tabbed format:
{
  "timestamp":"20210422T16:40:00",
  "id":"abcdef-1234"
}
Mixed format:
{
  "timestamp":"20210422T16:40:00", "id":
"abcdef-1234"
}
Multiple Logs
Accepts multiple JSON objects, representing multiple sample logs, each separated by a carriage return.
The following are examples of multiple logs separated by carriage return:
Compact format:
{"timestamp":"20210422T16:40:00","id":"abcdef-1234"}
{"timestamp":"20210422T16:43:00","id":"xyzmno-8754"}
Spaced format:
{ "timestamp": "20210422T16:40:00", "id":" abcdef-1234" }
{ "timestamp": "20210422T16:43:00", "id": "xyzmno-8754"}
Mixed format:
{ "timestamp": "20210422T16:40:00", "id":" abcdef-1234" }
{"timestamp":"20210422T16:43:00","id":"xyzmno-8754"}
File Import
Accepts one or more files, and processes the contents according to the selected options.
For details on the possible import options, refer to File Import of Log Samples below.
-
Click the Add to Queue
When using a file import, more steps are required. Refer to File Import of Log Samples below for more information.
File Import of Log Samples
When File Import is selected during step 2 of the previous section, clicking the Add to Queue button in step 3 presents additional options to determine how the file(s) are processed.
-
Select one of the following options:
Option
Description
As a Single Log
Select this option if each uploaded file contains a single JSON log.
Good examples of single JSON logs are outlined in step 2 in the section above.
As an Array of Logs
Select this option if each uploaded file contains an array of one or more logs.
The following are examples of log samples in an array:
Compact format:
[{"timestamp":"20210422T16:40:00","id":"abcdef-1234"},{"timestamp":"20210422T16:43:00","id":"xyzmno-8754"}]Spaced/tabbed format:
[
  {
    "timestamp":"20210422T16:40:00",
    "id":"abcdef-1234"
  },
  {
    "timestamp":"20210422T16:43:00",
    "id":"xyzmno-8754"
  }
]
Mixed format:
[{
    "timestamp":"20210422T16:40:00","id":"abcdef-1234"
  },
  {"timestamp":
"20210422T16:43:00",
    "id":"xyzmno-8754"}
]
As a Set of Logs
Select this option if each uploaded file contains a set of multiple logs, separated by carriage return.
Good examples of JSON log sets ("multiple logs") are outlined in step 2 in the section above.
The process of uploading log sample files as a set is very dependent on how the logs are formatted:
-
No more than one log per line.
-
Empty lines are ignored.
-
Each line must contain a proper JSON entry; improperly formatted lines are ignored.
-
Each line must be separated by at least a carriage return character (\r aka CR aka ASCII #13).
-
Line feed characters (\n aka LF aka ASCII #10) are ignored.
-
-
Select the file(s) from your machine to begin the upload.