The User Anomaly Score is a single number trying to tell a complex overall story. There are several different ways of computing this number. Ultimately, this single number cannot tell the whole story and may not satisfy every analyst or provide enough context for every scenario.
For example, a simple average of the hourly Event Scores would be influenced by the absence of activity, by a high number of low scores, and would tend to disregard high scores. A conditioned average would tend to highlight high scores, and disregard lower noise. Using a maximum function would likely score everyone as 90+. It is also worth noting that a maximum function or something similar would eliminate the ability to identify the difference between a user with a single score of 99 during the 24-hour period and a user with multiple scores of 99 during the 24 hour period.
Each behavior is scored every hour to produce an individual behavior score:
|
|
b1 |
b2 |
b3 |
b4 |
b5 |
|---|---|---|---|---|---|
|
t0 |
87 |
2 |
19 |
32 |
99 |
|
t1 |
3 |
1 |
4 |
19 |
20 |
|
... |
... |
... |
... |
... |
... |
|
... |
... |
... |
... |
... |
... |
|
t23 |
1 |
3 |
65 |
17 |
5 |
The entire 24 hours of behavior scores is aggregated to produce the User Anomaly Score. We have chosen to use a conditioned mean for this aggregation. That is, the User Anomaly Score excludes numbers below a threshold, as well as excluding empty values.
|
User Anomaly Score |
37 |
|---|
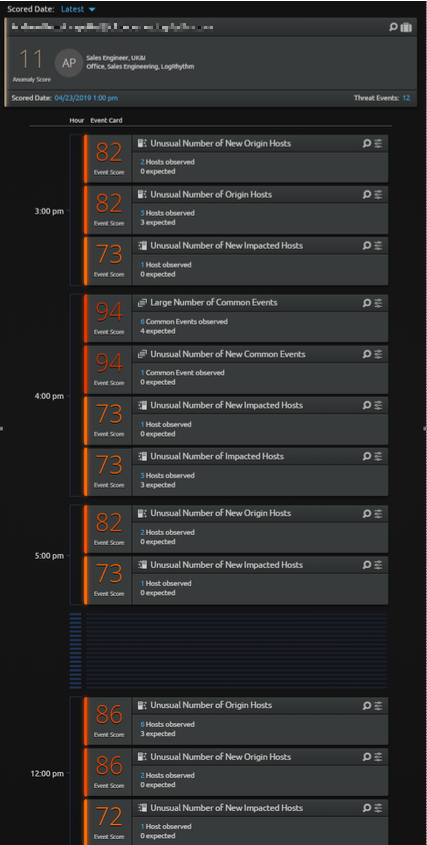
Behavior scores that do not reach a significant behavior and feature contribution threshold do not display in an Event Card, but they are still considered in the User Anomaly Score. For example, the following image shows a user with an overall User Anomaly Score of 11, but there are multiple high value Event Score cards. This occurs when there are many low-scoring behaviors which are included in the User Anomaly Score, but they are not high enough to warrant an Event Score card by themselves.
Each of the individual behaviors b1...b5 is comprised of a number of features. For example, f1...f7 are modeled (that is, we observe a baseline of the features that comprise a behavior and build a model based on this baseline). To produce a score for each behavior, the underlying features of that behavior are observed over an hour, and the observed values are compared against the values predicted by the model. The collective deviations are used to determine the anomaly score for that particular behavior. This is the number displayed on the Event Score cards:
|
|
f1 |
f2 |
... |
... |
f7 |
|---|---|---|---|---|---|
|
Expected (modeled) |
30 |
2 |
... |
... |
1 |
|
Observed |
31 |
14 |
... |
... |
2 |
The aggregated total of the evaluated features produces the behavior score that is displayed on the Event Score card. In this example, the score is 99. The system also assesses how much each of the individual features contributed towards the overall behavior score, and the feature descriptions that made a meaningful contribution are used for the Event Scores of that behavior type in the Event Score cards. While there is only one score of 99 in the table above, that score may be surfaced in the timeline multiple times.
In the following example, the behavior score related to Common Events is predominantly made up of three different features: Large Number of, Unusual Distribution of, and Unusual Number of. Each of these features contributes a meaningful proportion of the ultimate behavior score.
There may be other features that contribute to that score, but that contribution is either minimal or negligible.
The following is an example of what the timeline might display:
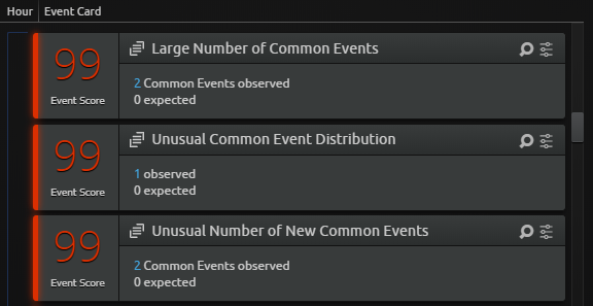
Even though there are three 99 Event Scores, they are all related to the same behavior (indicated by the icon on each card ![]()
Every Event Score card displays an observed and expected number. Do not be tempted to focus on the observed and expected numbers simply because they seem more tangible, where the Event Score might seem more ephemeral. The Event Score is, in fact, much more important, and the observed and expected numbers may be misleading in some cases.
Score Summary
Given all factors, a single very anomalous activity in one hour tends to drive up the overall User Anomaly Score, but that depends on what else has changed or remained the same. This is how a conditioned mean works. The score shows how anomalous a user's overall behavior is today compared to their own behavior (and peers) over the past thirty days. One user action (for example, a login from a different geographical location) may be significantly different, and the Event Score for that behavior for that hour reflects that fact. If the user had no other Event Scores in the day, the User Anomaly Score would be high, but if they had many other low scoring behaviors, that would tend to draw the User Anomaly Score down.
Anomaly vs Threat
LogRhythm UEBA (CloudAI) is LogRhythm's advanced UEBA solution that leverages machine learning analytics to perform anomaly detection. This solution is designed to complement and enhance the existing out of the box UEBA detection capabilities and KB content in the LogRhythm SIEM.
CloudAI considers the threat risk relevances of the anomalies that it finds when calculating the user anomaly score, so the highest user score is not only the most anomalous but is also the user who represents the highest threat risk.
New Users
When a new user is added after the initial deployment, all of their activity shows as anomalous for the first day. In general, scores become more meaningful with a baseline of approximately 7 days, and ideally 14 days. This is the reason behind the Ignore list. It is not expected that the monitored users change often, so we allow visibility into the activity, but provide the Ignore list especially built to hide the results in the first few days.
Each time a new user is added to the Monitored Identities List, there is no existing history for that user in CloudAI, and you must wait for 30 days before there is a baseline equivalent to the length of the baseline all other users have. For this reason, you should not take users in and out of CloudAI without very good reason, since a new baseline needs to be rebuilt each time.
This situation for new users differs from the initial setup of CloudAI where no results are returned for 48 hours. This is because a 24 hour baseline must be built, followed by 24 hours of activity to compare to it before any results are available.