How Activity is Processed
Event Scores and User Anomaly Scores are calculated four times daily at 00:00am, 06:00am, 12:00pm, and 06:00pm UTC. Each processing run always processes the last 6 hours of activity up and then combines the results from the previous three processing runs to calculate the overall User Anomaly Score for the last 24 hours.
Note that the frequency of the processing runs is subject to change.
You can tell when the last run happened from the date and time information shown on the Top Anomalous Users widget. For example, the date and time information might display the following:
07/23/2019 7:00 am - 07/24/2019 7:00 am
In this example, the last processing run delivered User Anomaly Scores for each user during the timeframe from 06:00am UTC on July 23rd to 06:00am UTC on July 24th (an entire 24 hour period). Why does it say 7:00am in the display?
The processing run always runs on UTC time, but the display shows the equivalent localized time of the appliance the Web Console is running on. In the example, the appliance happens to be in the United Kingdom during the summer, so the local time zone is UTC+1. The display shows 7:00am-7:00am for the 6am processing run, or 1:00pm-1:00pm for the 12:00 midday processing run. This always depends on when the latest processing run was performed.
Consider a single processing run. The machine learning engine is comparing the last 6 hours of activity to the previous 29 days.
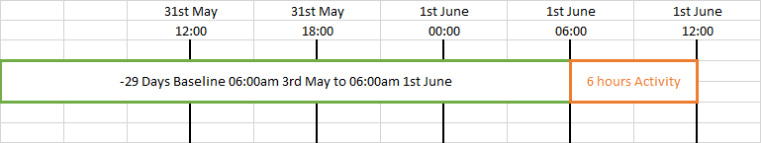
The processing run performed on June 1st at 12:00pm takes the activity for the previous 6 hours of June 1st and compares that activity to the previous 29 days.
In the context of the four processing runs that take place over the course of one day (starting June 1st at 12:00pm), the results from that run are displayed for the next 6 hours until the next processing run. The next processing run that takes place at 18:00 on June 1st processes the activity for the last 6 hours and displays those results for the next 6 hours. This process repeats continuously.
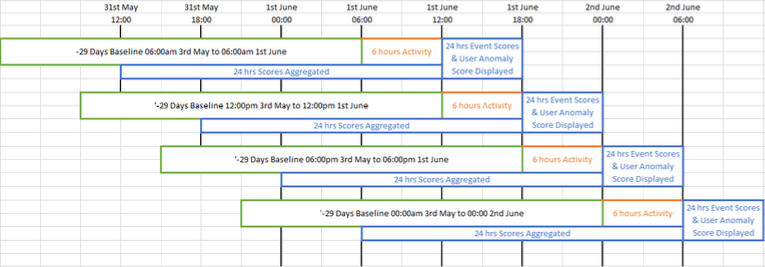
Every 6 hours, each of the previous 6 hours are compared to the previous 29 days, and those results are visible for the following 6 hours.
The processing run looks at the last 6 hours and scoring in per-hour buckets compared to the last 29 days, so new Event Scores are generated for the last 6 hours each run. The User Anomaly Score always represents the composite scores for the last 24 hours (that is, information is aggregated from the last four processing runs).
Note that scoring is done on a per-hour basis, which is to say that each of the individual hours is scored independently against the entirety of the baseline without respect to hours of the day in the baseline. The exception to this is the time-based behavior model Login Time which compares each hour against the corresponding hour across the previous 29 days. For example, comparing 1:00pm-2:00pm to all the 1:00pm-2:00pm hour buckets for the previous 29 days.

Top Anomalous Users
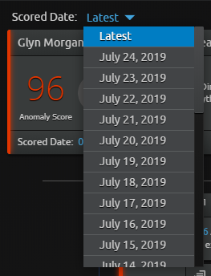
From the Threat Event Timeline for a particular user, the overall User Anomaly Score displays at the top followed by Event Score cards. The Scored Date dropdown at the top of the User Anomaly Score card shows Latest as the selected view by default. This indicates that the displayed results are from the most recent processing run performed by CloudAI. Within the User Anomaly Score card there is a Scored Date, as well. For example, the Scored Date might display the following:
07/23/2019 7:00am
This indicates the date and time of the scoring run for which activity is being scored. In this case, you might be viewing the Threat Event Timeline on the morning of July 23rd, and the most recently scored data is from 7:00am yesterday to 7:00am today.
More simply, the Latest results always displays the results from the previous processing run (00:00am, 06:00am, 12:00pm, or 06:00pm UTC), depending on the time of day the timeline is being viewed.
To select from a list of previous dates, click the Scored Date dropdown.
The Latest Scored Date may display the results of a processing run at 00:00am, 06:00am, 12:00pm, or 06:00pm UTC. All other Scored Dates only display a 24 hour processing run (00:00am-00:00am).
The User Anomaly Score card also indicates the total number of Threat Events that are shown in the timeline in the bottom right corner. For example, the Threat Event Timeline may display 21 Threat Events. The timeline below the overall scorecard shows the Event Score cards in chronological order for the 24 hour period that was being scored.