Axon Agent Log Levels
In certain scenarios, enabling a higher level of logging may be beneficial to troubleshooting an Axon Agent installation. This logging level is set on a per-agent basis, and is not enabled on the Agent Profile level. This allows for more targeted usage of elevated logging for the Axon Agent.
It is suggested to leave the log level on “info” during normal operation. Selection of “Debug” or “Trace” level logging may result in a large number of logs being generated.
“Debug” and “Trace” level logs are excluded by default from being sent to the Axon UI by the Agent Logging Collector. These logs must be viewed locally in the lragent.log and fluentd.log files. See the troubleshooting page on your operating system (Windows or Linux) for file locations.
Configure Axon Agent Log Levels
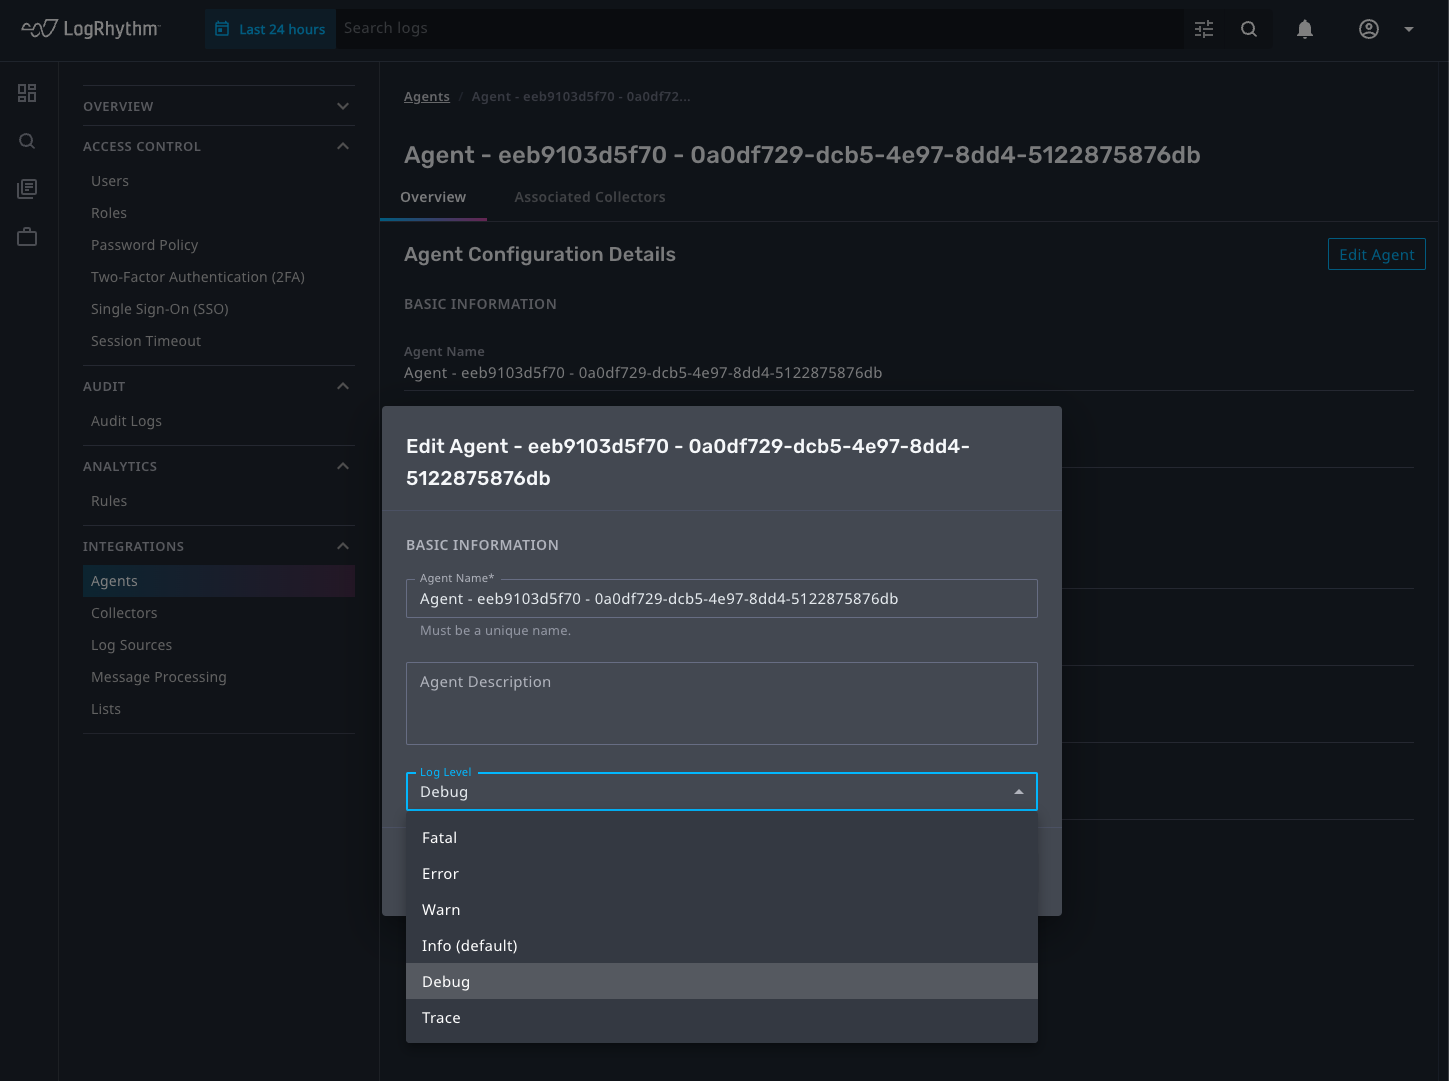
The Axon Agent logging level can be set in the “Edit Agent” screen. This is accessed from the Agent Overview page:
From the Dashboard, click the Administration cog in the lower-left corner.
Under the Integrations section, click Agents.
Click the Agents tab.
Select the Agent that needs to have its log levels modified.
The Agent Overview page appears.Click Edit Agent.
The Edit Agent pop-up appears.
Open the Log Level pop-up and select from the following choices:
Fatal
Error
Warn
Info (Default)
Debug
Trace
When finished, click Save.
The Axon Agent is updated successfully.
These log levels range from the least verbose (Fatal) to the most verbose (Trace). For example, setting the log level to “Fatal” means only fatal-level logs are shown in the log file. Setting the level to “Trace” means that all logs possible are shown, including the extremely verbose trace-level logs.
“Debug” level logging may be useful for examining normal Agent operation; however, “Trace” level logging should only be turned on when actively diagnosing a problem with Axon Agent. Trace logging is extremely verbose.
Axon Agent log level is a global modifier, and changes the log level of the Axon Agent itself, all enabled collectors, and FluentD.
