Errors Occur During Open Collector Deployment Running the init Command
The likely explanation is that the necessary ports are not open. Check the ports described in Install the Open Collector and see the troubleshooting steps in I Think A Port May Not Be Open.
Exporting Log Data to File
If you want to write log data to a local file for viewing or recording of errors, you can do this by running the troubleshoot command:
./lrctl <service> troubleshoot export --outfile troubleshoot.tar.gz
-
Where <service> is a LogRhythm Open Collector component such as oc, eventhubbeat, metrics, etc.
-
Unpack the tar.gz file to view the log data
After Configuration, No Pending Log Source Appears in the Client Console
After logs are flowing from the Beat to Open Collector to System Monitor Agent, the Pending Log Source may take up to 15 minutes to appear in the Client Console.
The best place to start looking is Metrics. Metrics quickly show you if any logs are reaching the Open Collector.
-
If Metrics is unavailable, check:
-
The service status
./lrctl metrics status
-
That port 3000 inbound is open on the Open Collector
-
-
If Metrics shows all 0 graphs, check the Beat and Open Collector status
./lrctl <beatname> status
./lrctl oc status
-
If Metrics shows logs flowing through the Open Collector, check the System Monitor Agent and associated firewalls (outbound from Open Collector and inbound into System Monitor Agent).
Logs Do Not Have Correct Timestamps
The Open Collector extracts the timestamp from the log message and sends it in the syslog message. The Agent needs a new Syslog Relay Regular expression to extract that timestamp; otherwise logs have a timestamp from when they were received by the System Monitor Agent.
For more information, see the Configure the <Beat Name> Log Source in the SIEM topic in the applicable Beat documentation.
-
Ensure the System Monitor Agent collecting the logs has:
-
The correct Syslog Relay Regular Expression at the top of the list
-
The Open Collector IP Address in the list of Syslog Relay IPs
-
-
Ensure the Open Collector configuration has the correct timezone of the System Monitor Agent. You can verify it using the command:
./lrctl oc config view | grep "Timezone"
I Think a Port May Not Be Open
You can use telnet to check if a port is open.
|
|
-
If the port is open, you will see one of the following:
-
Connected to ...
-
Connection closed by foreign host
-
-
If the port is not open, you will see one of the following:
-
Connection timed out
-
Network is unreachable
-
The following example shows how to install telnet, hit gcr.io (Google Container Registry) over 443 but not over 4436 (a blocked port), and then check a System Monitor IP (10.4.1.64, in this case) over port 514.
|
|
When attempting to start OC Metrics or the Open Collector, you may see the following error message:
|
Failed to fetch latest version from https://raw.githubusercontent.com/logrhythm/versions/master/latest.yml: Get https://raw.githubusercontent.com/logrhythm/versions/master/latest.yml: dial tcp: lookup raw.githubusercontent.com on 10.128.64.252:53: read udp 172.17.0.2:54742->10.128.64.252:53: i/o timeout. Falling back on existing version.
|
|---|
-
If you are on CentOS 8 or RHEL 8, this message indicates that you did not change "nftables" to "iptables" in your firewalld.conf file. Please see OS installation instructions for your version of Linux.
It's All Broken
If a configuration is broken, it may be easiest to reset and start fresh. Use the following commands.
Open Collector
./lrctl oc stop
./lrctl oc config remove
./lrctl oc config create
Beat
./lrctl <beatname> stop
./lrctl <beatname> config remove
./lrctl <beatname> config create
Remove Docker Volumes and Containers
docker volume ls
docker container ls
docker volume rm <volumename>
docker container rm <containername>
Completely Remove Docker
sudo yum remove -y docker-ce docker-ce-cli
Open a Support Ticket
In the event you have exhausted the troubleshooting guide, open a support ticket using the contact information provided in the front of this guide.
-
List troubleshooting steps already taken.
-
Run:
./lrctl open-collector troubleshoot export --outfile troubleshoot.tar.gz
-
Save the
troubleshoot.tar.gzfile to provide it to the support team.
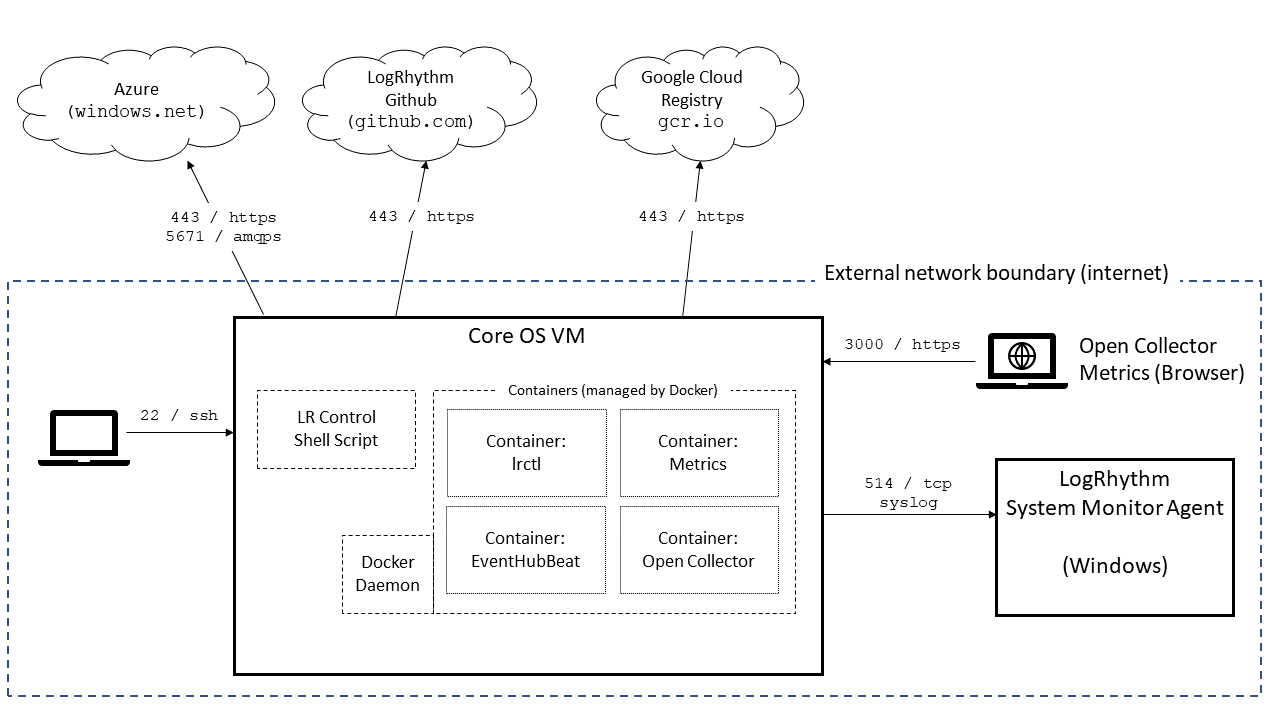
System diagram