CloudAI Lab is now UEBA Lab.
In the Web Console at the top of the UEBA Overview page, you can view UEBA processing statistics, including users, observations, and threat events. You can also access UEBA Lab, a fully web-hosted set of UEBA features.

To access UEBA Lab:
-
In the upper-right corner, click UEBA Lab.
By default, the Heatmap view appears. -
To view Asset Details, click Asset Details on the main toolbar.
When you switch between Heatmap and Asset Details views, the specified timeframe persists in the new view.
UEBA Lab is only available in SIEM versions 7.4.8 and later.
UEBA Lab is subject to frequent changes to provide the latest features and analytics.
UEBA Lab Features
The following features are available in UEBA Lab:
-
Assets Details:
-
Identities Details: Identity job title, hosts that the identity interacted with, identity's timeline, identity's peers.
-
Host Details: IP and Hostname when present, Identities that interacted with the host.
-
-
Heatmap for identities
UEBA labels, when available, will be present in both features.
Identities and Hosts Interactions
The asset details feature allows UEBA Lab users to search and view interactions between whitelisted assets. An asset is an entity monitored by UEBA such as a host or identity. Users can pivot between hosts and identities to further explore interactions.
Identity View
Identity View displays a list of assets that a user (identity) has interacted with during the specified time range. While in Identity View, you can do the following:
-
Change the time range to update the list of the identity's interactions.
-
Page through the list to see all the identity's interactions during the specified time range.
-
Click an asset on the list to view its interactions for the same time range.
Host View
Host View displays a list of assets that a host has interacted with during the specified time range. While in Host View, you can do the following:
-
Change the time range to update the list of the host's interactions.
-
Page through the list to see all the host's interactions during the specified time range.
-
Click an asset on the list to view its interactions for the same time range.
To access the Identities and Hosts Interactions feature:
-
On the top navigation bar in the Web Console, click UEBA.
-
In the top-right corner of the page, click UEBA Lab.
The UEBA Lab main page appears.
-
In the Explore: Identities and Hosts box, click Try It.
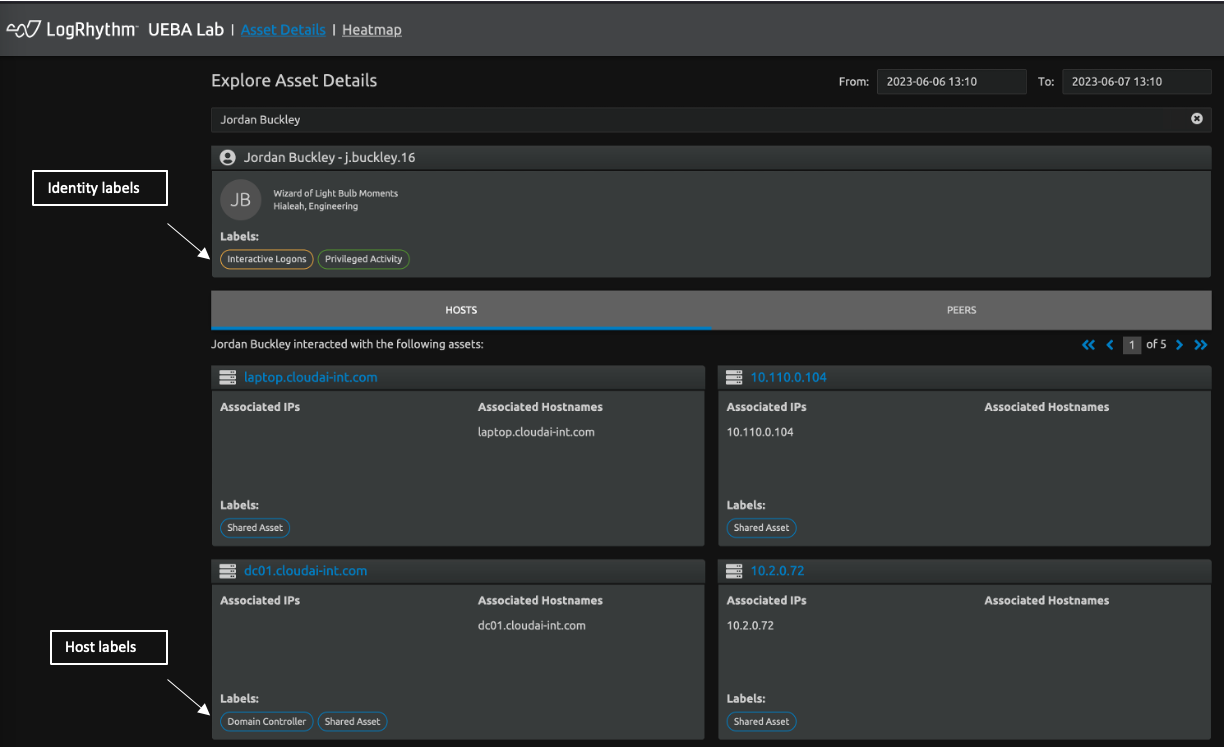
The Search for Assets view appears, showing a search bar and a date range selector at the top.
-
To set the date range, enter dates in the From and To boxes in the upper-left corner. The date range defaults to the past 24 hours.
-
To search for assets, start typing your search term In the search bar. UEBA Lab auto-populates a list of asset interactions that occurred within the designated date range.
When you search for an asset, the results appear in a drop-down list. The drop-down list is limited to 20 results, so you may need to refine your search term to find the asset you want. Also, if no interactions occurred within the date range you selected, the asset will not appear in the results.
-
Click on an asset in the drop-down list to view its interactions. Identities and Host labels appear when available.
-
To view interactions for another date range, enter new dates in the From and To boxes in the upper-left corner.
Anomaly Heatmap of Identities
The Anomaly Heatmap of Identities is a grid that shows anomalous behavior found for a specified identity over a 24-hour period.
Each row of the grid maps an anomaly type into 1-hour blocks from the specified 24-hour window. A yellow block indicates the anomaly type occurred during that 1-hour timeframe. The brighter the yellow block, the higher the anomaly score for that hour. You can click a yellow block to view details for the anomaly type during that 1-hour block. The details appear below the heatmap grid. The following anomaly types (risk events) are mapped in the grid:
|
Anomaly Type |
Icon |
Description |
|---|---|---|
|
New Impacted Hosts |
|
|
|
New Origin Hosts |
|
|
|
New Origin Locations |
|
|


To access the Anomaly Heatmap of Identities feature:
-
On the top navigation bar in the Web Console, click UEBA.
-
In the top-right corner of the page, click UEBA Lab.
-
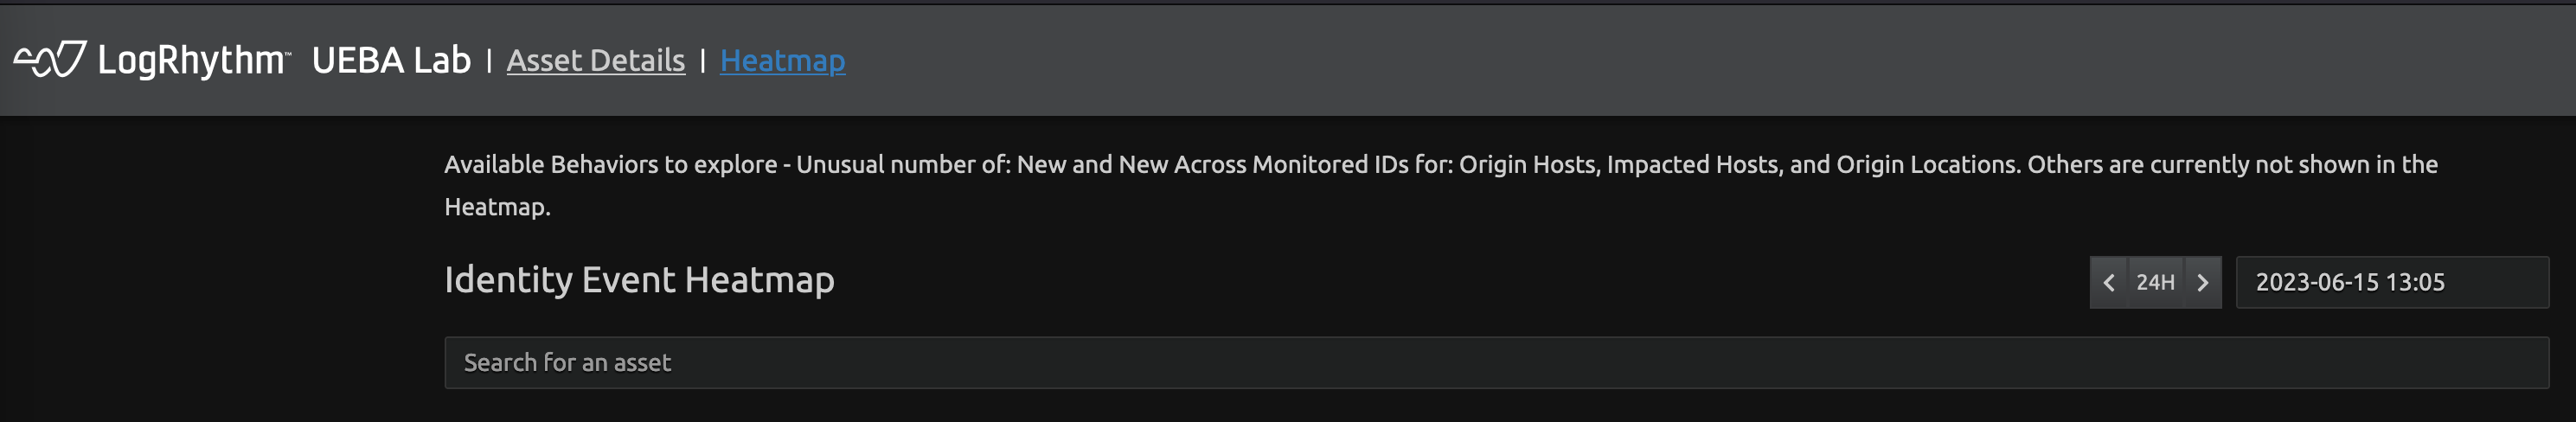
In the Explore: Anomaly Heatmap of Identities box, click Try It.
A search bar appears.
-
To search for identities, start typing your search term In the search bar. UEBA Lab auto-populates a list of identities.
When you search for an identity, the results appear in a drop-down list. The drop-down list is limited to 20 results, so you may need to refine your search term to find the identity you want.
-
Click on an identity in the drop-down list to view its anomaly heatmap.
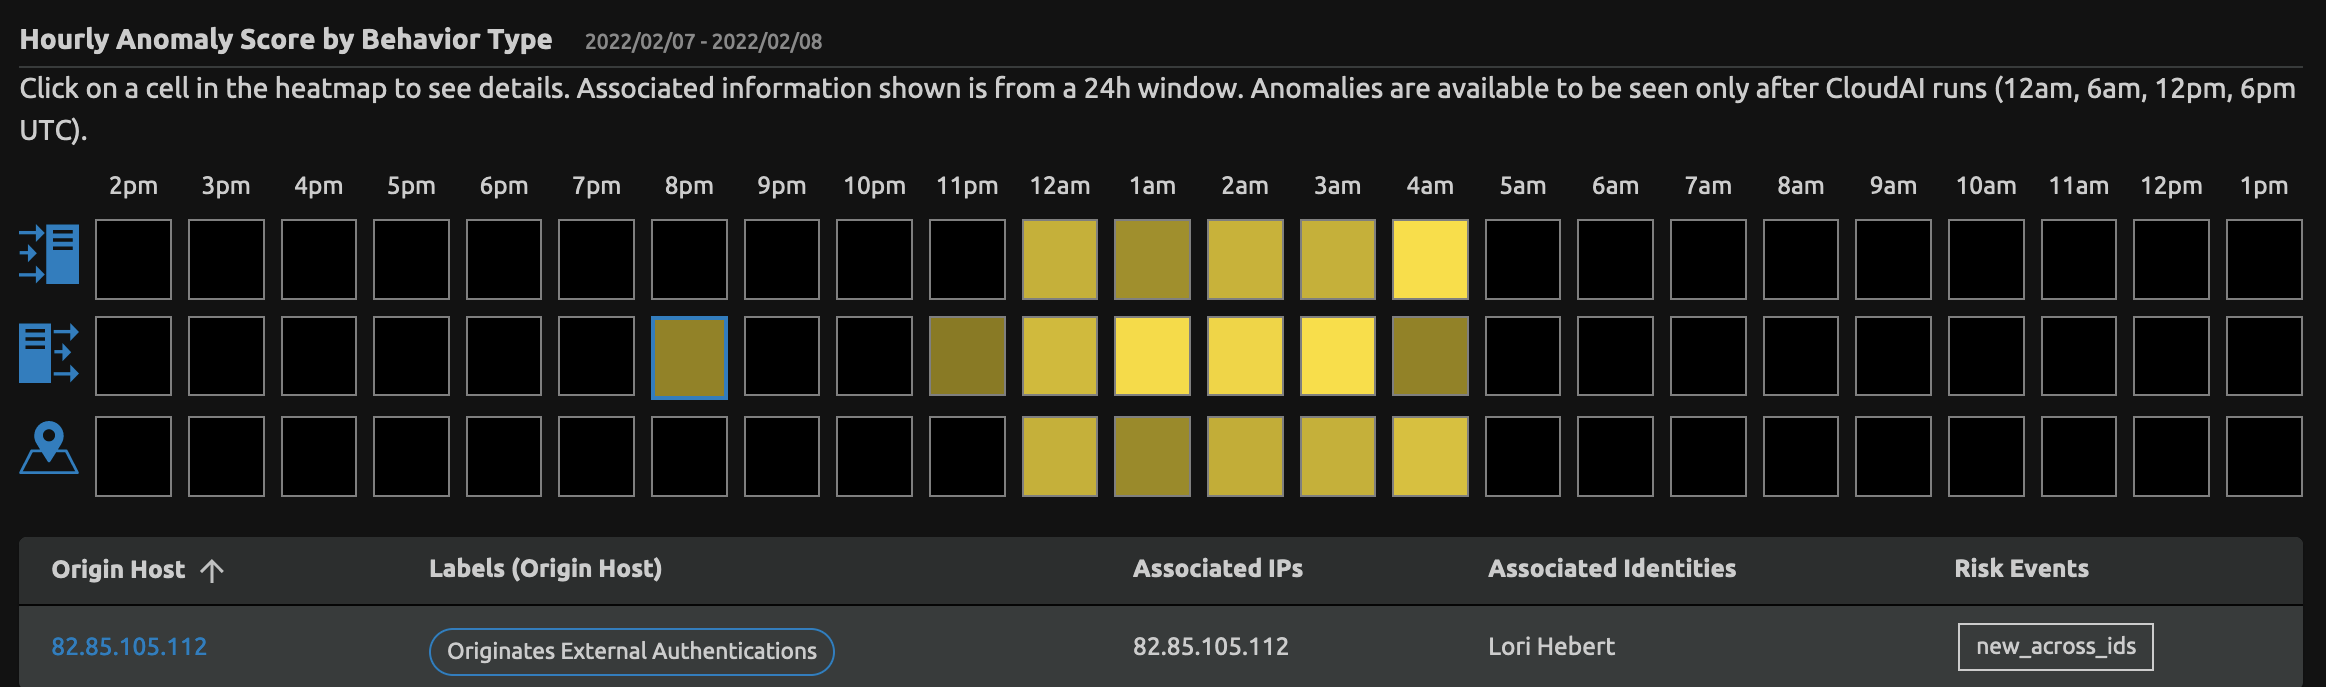
The anomaly heatmap appears. A yellow block on the grid indicates anomalous behavior occurred for the corresponding anomaly type within the corresponding 1-hour time block. The brightness of the yellow block indicates the anomaly score. The brighter the yellow block, the higher the anomaly score.
-
To view the details of anomalous behavior, click a yellow block.
A blue boarder appears around the yellow block, and details appear below the grid.
For example, in the heatmap below, the 8pm time block in the New Origin Host row has been selected. The details about new origin hosts for the 8pm time block appear below the heatmap grid.
-
To view more information about the origin host displayed below the heatmap, click the blue link shown in the Origin Host column.
If no information is available for the origin host, the value in the Origin Host column will not be blue.
When you click on a linked origin host, the Search for Assets view appears. For more information, see UEBA Lab | id (7.14.0)UEBALab IdentitiesandHostsInteractions.
-
To view the heatmap for a specific date, click the date box in the upper-right corner and select the desired date. Available dates appear on the calendar in black, and unavailable dates are greyed out. Available dates are limited to the past 30 days.
By default, the heatmap shows the past 24 hours when loaded.
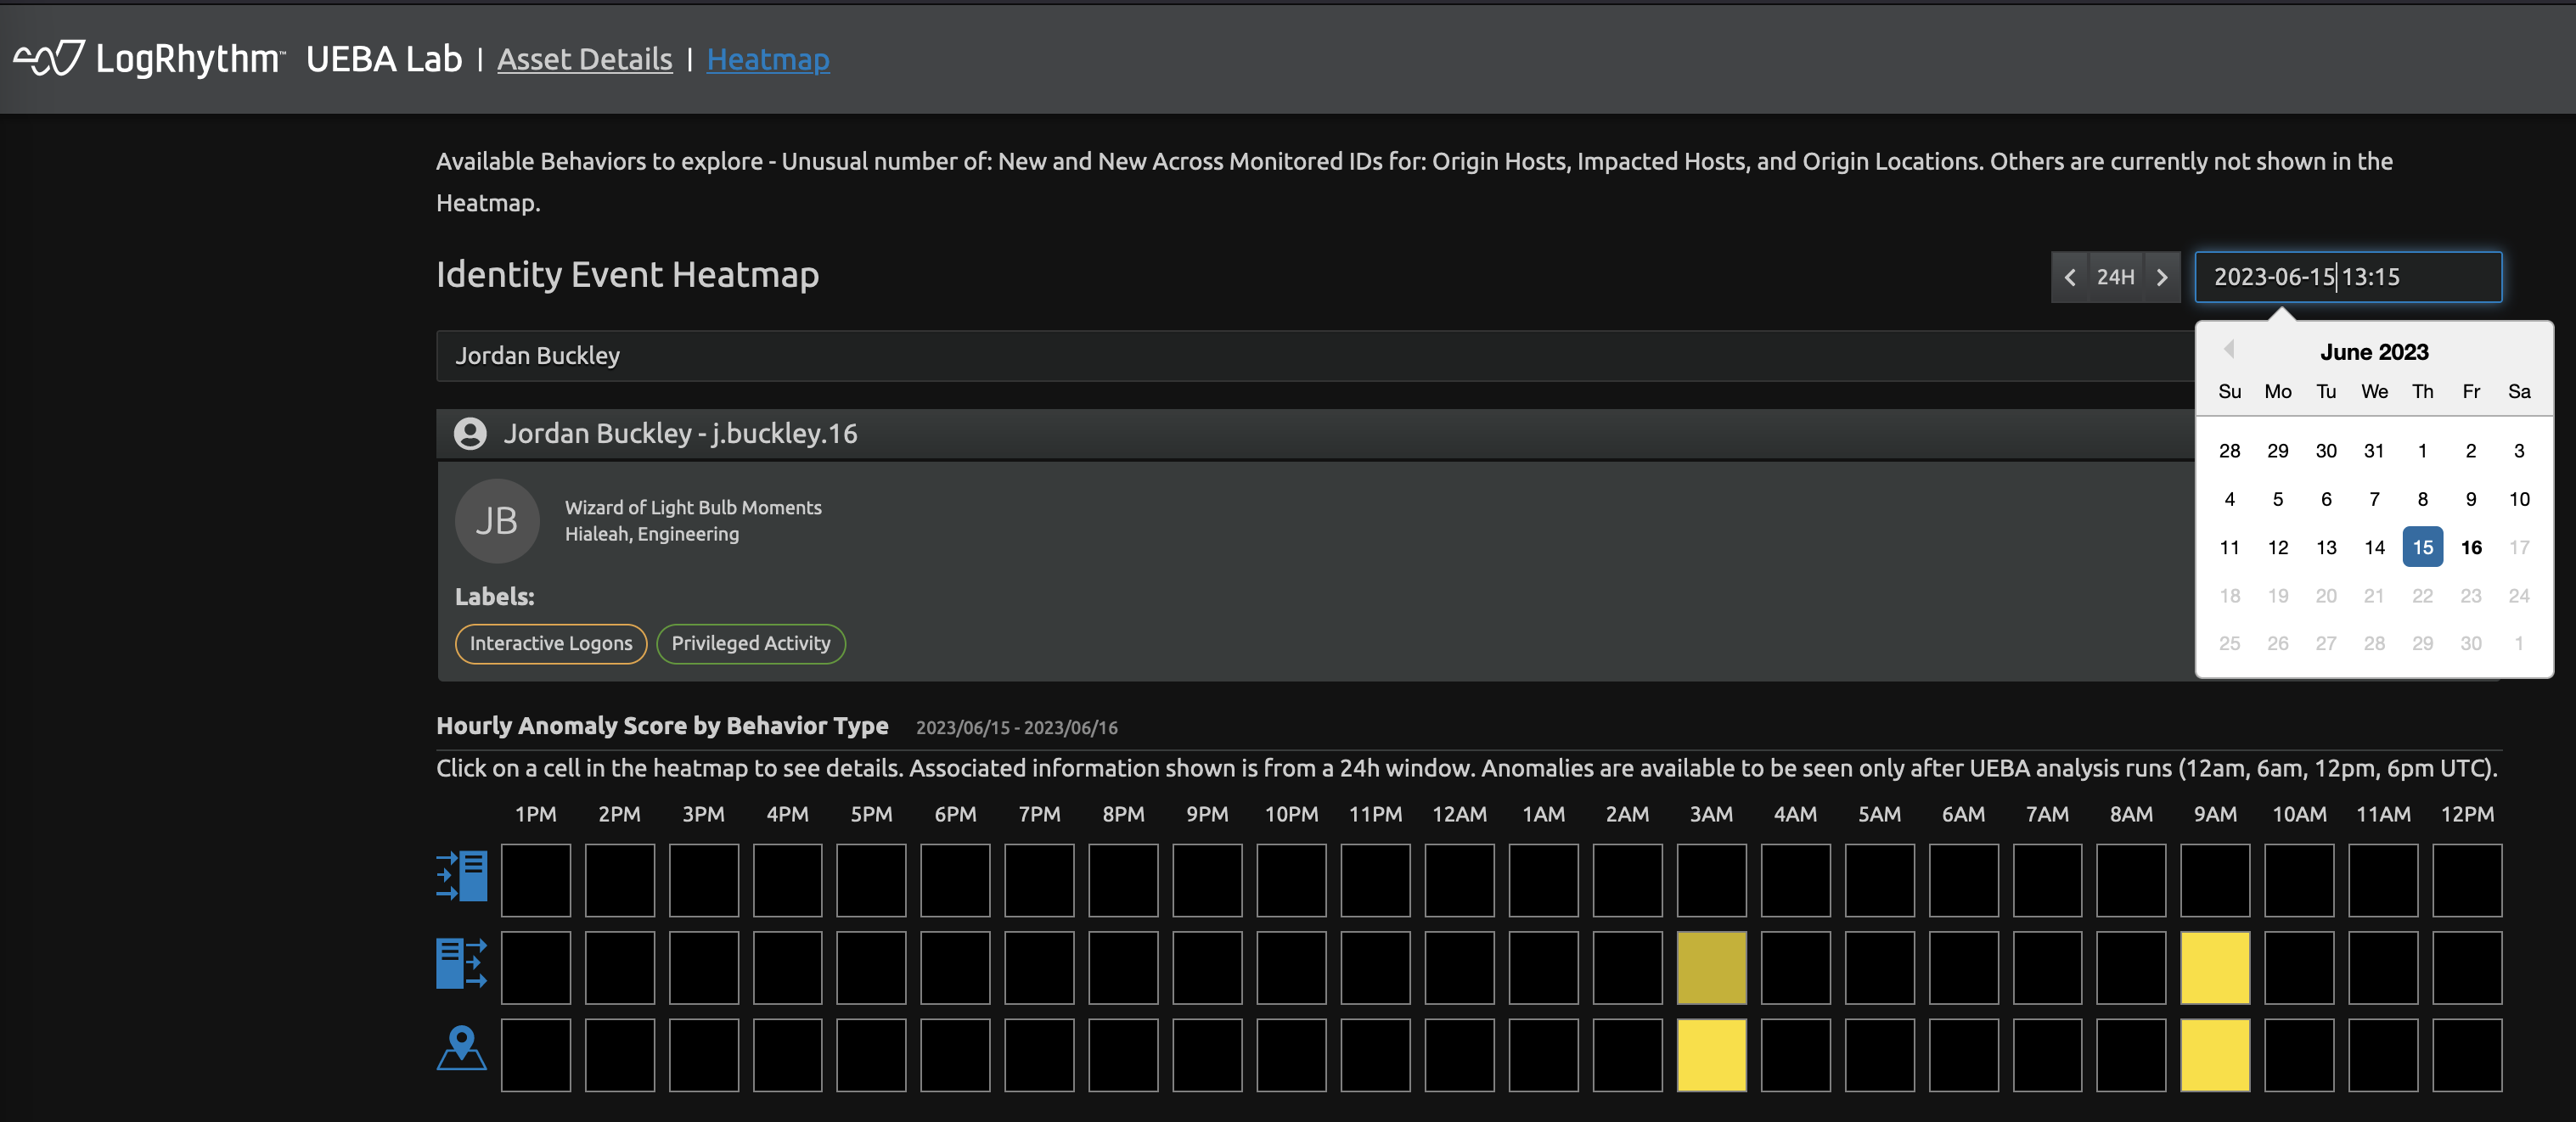
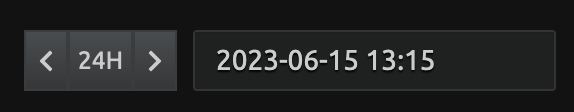
The < 24H > box allows you to reset the date to the past 24 hours or view the previous day or next day.
-
To reset the heatmap to the past 24 hours, click 24H
-
To view the heatmap for the previous day, click the < arrow.
-
To view the heatmap for the next day, click the > arrow.
-
The heatmap is not designed to be used as a search engine for anomalies. Its intended use is to add more context once you discover an identity with one of the anomaly types that are mapped in the heatmap. To determine identities of interest, use dashboards, searches, or identities timelines first.
UEBA Labels
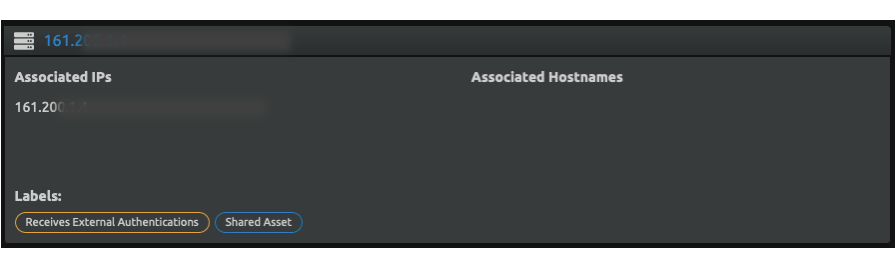
UEBA labels provide context about an asset (currently hosts or identities). They describe an asset's attribute to help you understand what the asset is and how it functions within the environment. Labels are derived from statistical and machine learning models operating on observations extracted from the security logs analyzed by UEBA over the previous 30 days. Although they are not explicitly time-based, labels persist on assets that generated relevant data within the last 30 days.
Labels appear on each asset in the UEBA Lab features. For example, the following asset has two labels: Receives External Authentications and Shared Asset.
The Labels that leverage all data are:
|
Label |
Description |
|
Domain Controller |
Asset is a domain controller. |
|
Dormant Account |
Identity showed no activity for at least one day in the past 30 days. |
|
Interactive Logons |
Identity has interactively logged on. |
|
Local Authentications |
Asset is OriginHost and/or ImpactedHost in local authentications. |
|
Originates External Authentications |
Asset is OriginHost in external authentications. |
|
Originates Internal Authentications |
Asset is OriginHost in internal authentications. |
|
Privileged Activity |
Identity has logs related to account management activity. |
|
Receives External Authentications |
Asset is ImpactedHost in external authentications. |
|
Receives Internal Authentications |
Asset is ImpactedHost in internal authentications. |
|
Service Logons |
Identity logged on as a service. |
|
Shared Asset |
Asset is accessed by multiple users. |
UEBA Labels based on NetMon data
Customers who have NetMon available in their environment are able to view additional labels in UEBA Lab asset views. The NetMon data augments the UEBA analysis and provides additional context about application family types associated with asset interactions.
The Labels that leverage NetMon data are:
-
Database server
-
Database client
-
File server
-
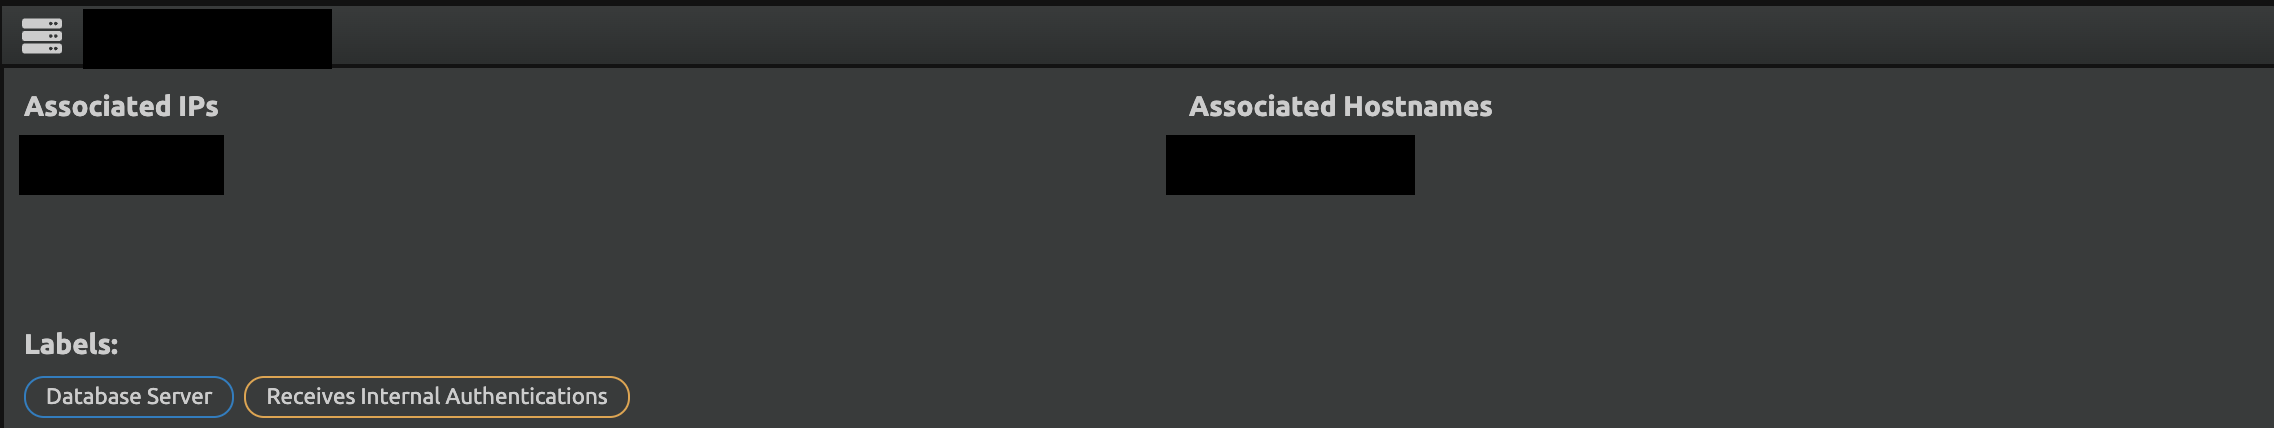
File server client
For example, the following asset has two labels: Database Server and Receives Internal Authentications.