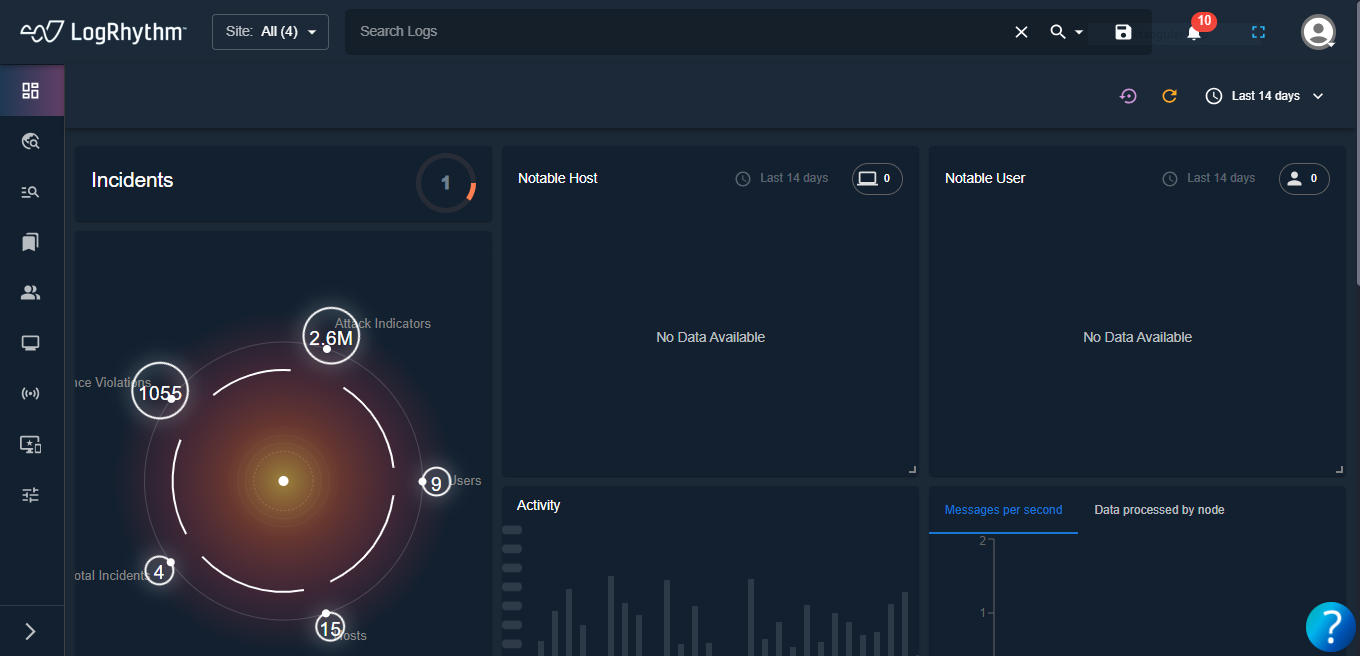
NDR Dashboard
When users log in to LogRhythm NDR, the Main Dashboard is the first screen they see. The Main Dashboard provides an overview of the application with real-time data.
Components of the Main Dashboard
| Section | Description | Location |
|---|---|---|
| Site Icon | Contains the list of sites for the user to select from the drop-down. | Upper left-hand side. |
| Search Bar | Allows to user to search for a particular log entry. | Along the top of the screen. |
| Search Icon | The search results for particular pages such as Incidents, Policy Violation, Activity, Mitre, Geo Activity, and Cases can be viewed from here. | Along the top-right of the screen. |
| Saved Queries Icon | The user can view already saved queries or can create a new named query by selecting this icon. | Along the top-right of the screen. |
| Notification Icon | User is able to view all the related notifications here. | Top right-hand side. |
| Fullscreen Icon | This icon enables the user to choose to go fullscreen while using the product. Once fullscreen is enabled, the Exit Fullscreen icon can be used to exit the fulscreen option. | Top right-hand side. |
| User Profile Icon | User activities can be performed from here, as follows:
| Top right-hand side. |
| Left-side Pane | Contains the list of activities that can be performed from this site. This pane can be expanded or collapsed as per user requirement. | Left-hand side of the page. |
| Date Range Picker Icon | The user can select to view the log activities for the past 14 days by selecting the time range. | Top right-hand side. |
| Refresh All Icon | This orange icon can be selected to refresh the feed. | Top right-hand side. |
| Reset Layout | This purple icon can be selected to reset the page layout. | Top right-hand side. |
| Resource Centre/Question Mark Icon | This is the resource center of the page and contains information necessary for the user such as:
| Bottom right-hand side. |
