TopX Analysis
The TopX Analysis feature provides a powerful, quickly configurable tool that offers custom views into logs and events based on metadata generated by LogRhythm. TopX allows you to select a standard metadata field (e.g., Common Event, Impacted Host, Origin Country), available metric (by count, by KBytes, by Packets), and available item (3, 5, 7, 10, 12, 15, or 20) to then view the top or bottom items within the result set.
Other available functionality includes:
- Viewing the data in chart and/or list format
- Viewing the chart in 3D
- Applying custom properties such as additional filters and a custom label
- Showing the total for the Other values outside the TopX items shown
- Full drill-down and one-click correlation support. For instance, double-clicking on a value in a TopX pie chart or list immediately drills down into the logs detail for that item
- Contextualizing on Host, Port, or User Information
- Adding Host as a Known Host
TopX Charts
You can access TopX Analysis from within Personal Dashboard or Investigator. They are identical between the two analysis tools. The TopX Analysis widgets, along with all others, are accessible from the Tools Selector which resides as a left pane within Personal Dashboard or Investigator.
When you open Personal Dashboard or Investigator and no TopX widgets are configured, they are listed as Unconfigured TopX in the list. Twelve TopX widgets can be configured per layout. Each layout has its own set of TopX widgets. Because the Top X widgets are part of a Layout, they can also be shared as part of that layout. For details on how to manage and use them, see Layouts.
You can also add values from a TopX chart to a list and export a whole grid from a TopX widget to a file.
TopX Use Cases
There are many use cases for TopX, but to give you an example, there are a few listed below:
- Configure TopX tools to show the top 10 attackers, target hosts, target applications, and countries or origin to obtain high-level visibility into threats.
- Configure TopX tools to show the top 5 hosts, applications, ports, and protocols generating network traffic.
- Configure TopX tools to show the top 10 events impacting production servers as well as the top 10 least observed events. Often events seen less often are the ones to be concerned about.
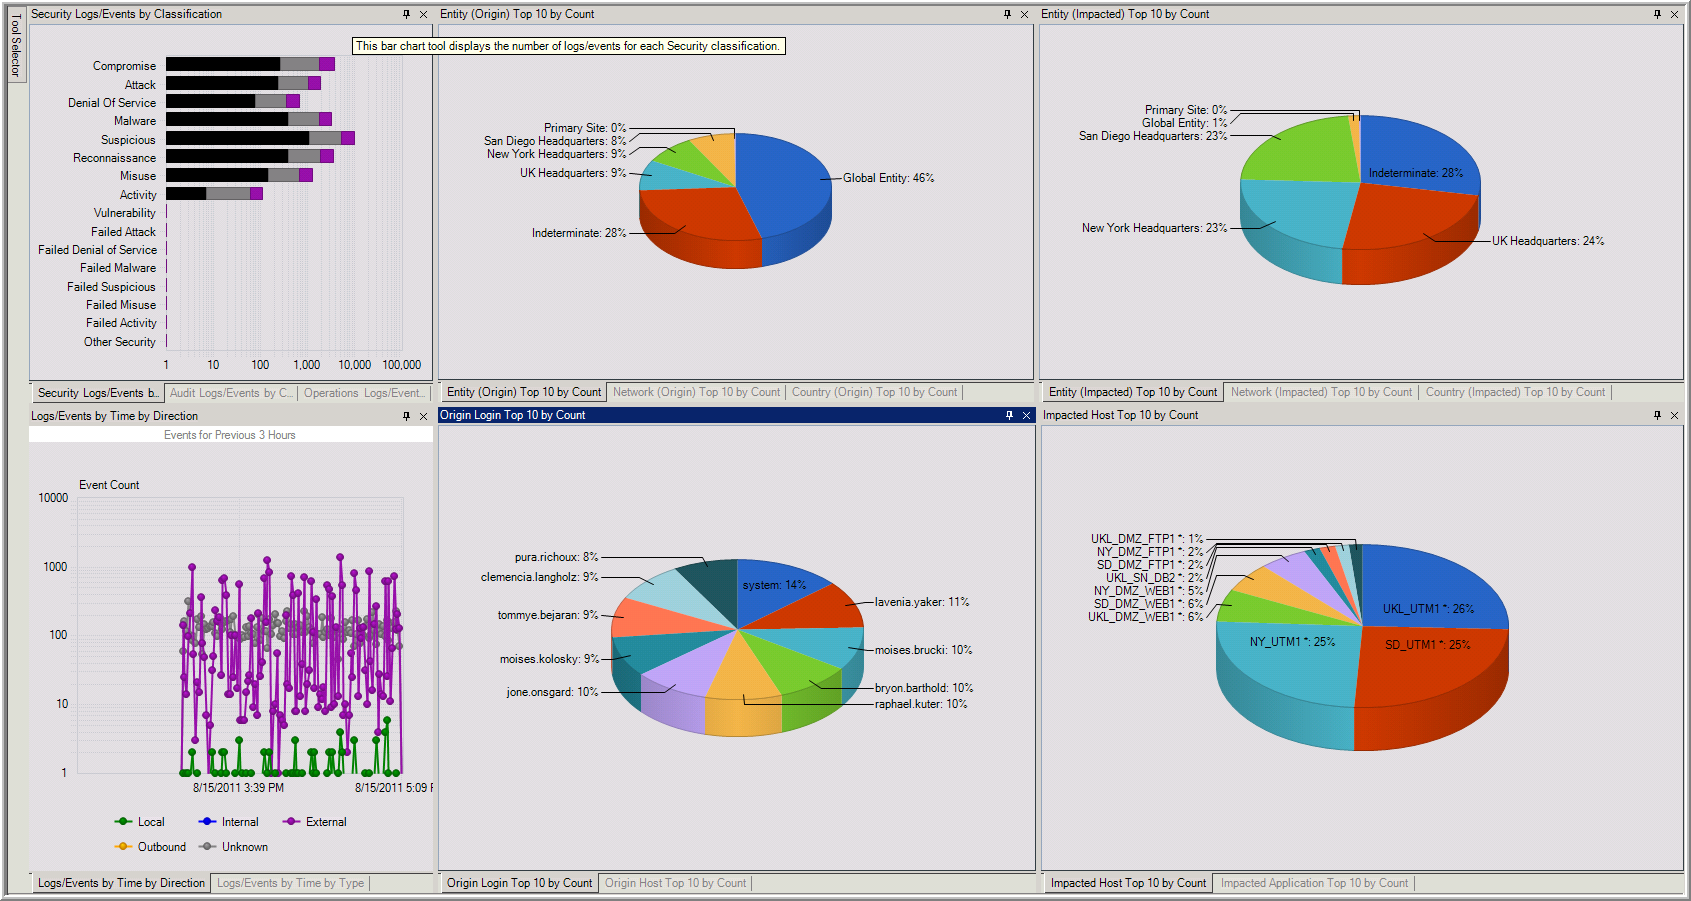
Examples
Analyst Model Example. This shows many TopX lists for an Analyst who wants to see the details.
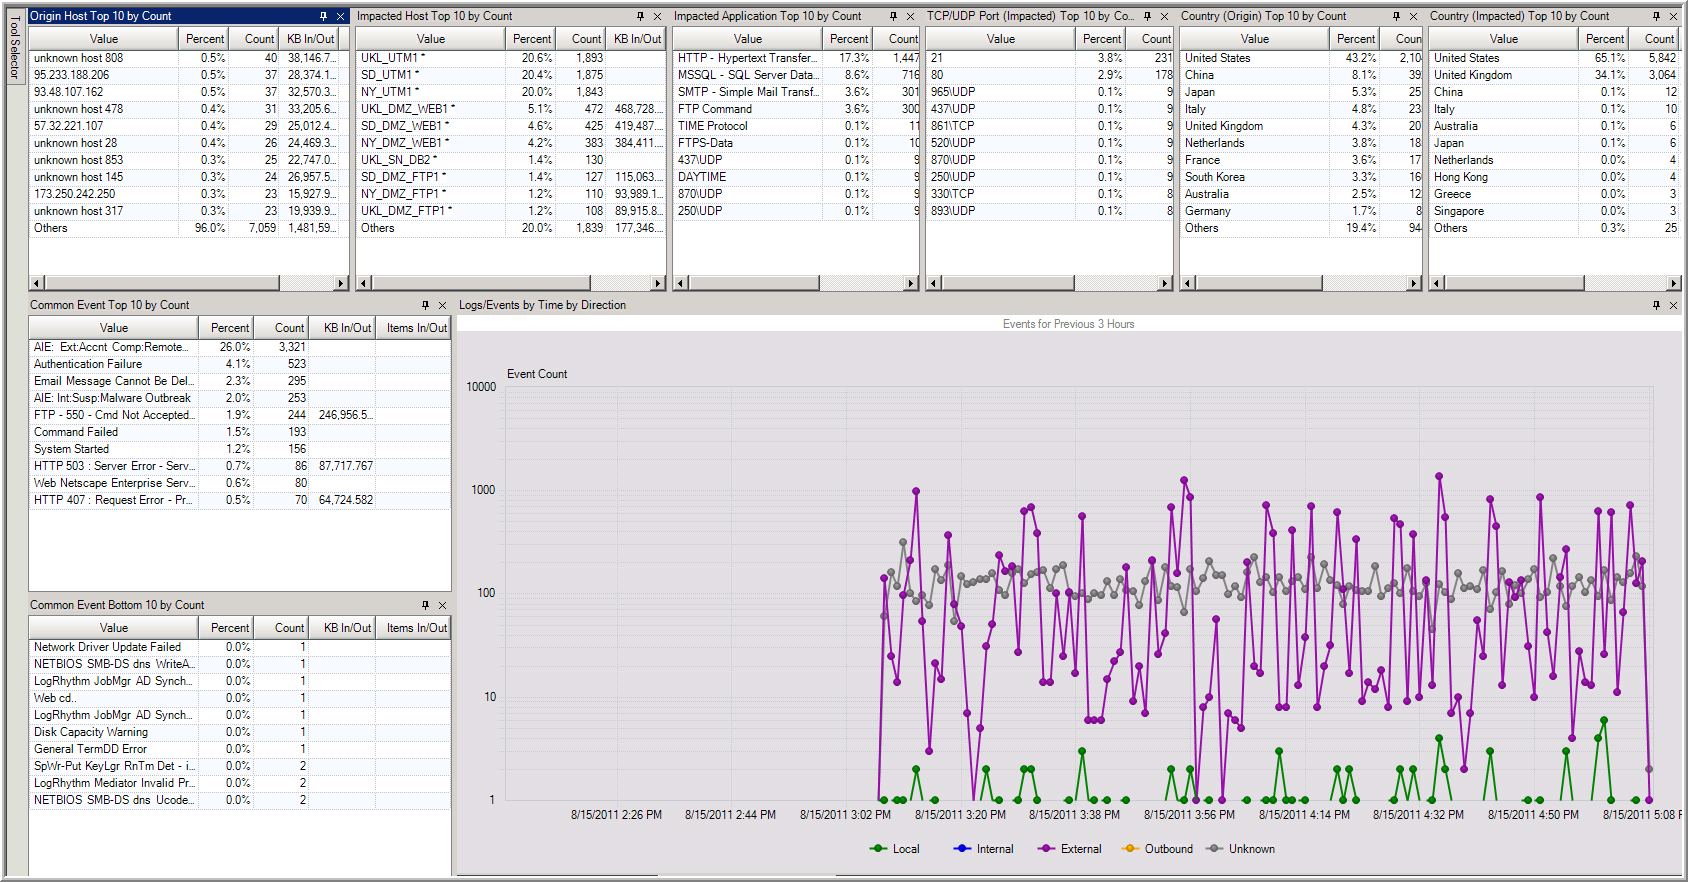
Executive Model Example. This shows many TopX pie charts for an Executive who just wants the big picture.