Dashboards
Dashboards refer to the interchangeable widget-based user interfaces on the Dashboards page, Analyze page, Cases page, and Reports page. Predefined dashboards are available for these pages, but you can also create, customize, and save additional dashboards to accommodate your different information needs.
When you first log in to the Web Console, the Dashboards page displays. This is your main view for reviewing real-time Events data as it is processed through LogRhythm SIEM in easy-to-read charts and graphs that automatically update their displays to reflect changes in live data. The Web Console can display up to the last 250,000 Events (approximately) in the cache.
If you are logged in as a restricted user, the Processing Rate gauge, Trend chart, Component Status widget, System Database Usage widget, and Threat Activity Map do not appear on the Dashboards page. Global Admins can set Management Permissions in the Client Console to allow Restricted Admins view permissions for the Database Usage, Component Status, and Processing widgets.
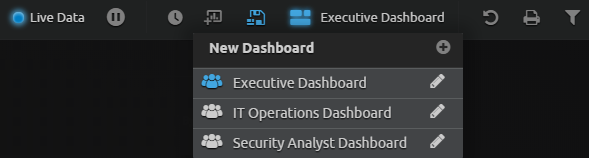
The name next to the Dashboard icon on the upper-right side of the relevant pages tells you which dashboard displays.
Public vs. Private Dashboard Layouts
Public dashboards can be accessed by all Web Console users, but only Global Administrators can create or modify them. A private dashboard view can be accessed and viewed only by the individual user who created it. Permission to create and manage private dashboards extends to all users.
You can download Dashboards by going to the LogRhythm Community and clicking on the Shareables link on menu at the top of the page. The filters allow you to choose from supported and unsupported Dashboards, as well as ones created by LogRhythm or by other users.