Analyzer Grid
LogRhythm Agents collect raw log data from various devices and also monitor hosts to gather forensic data. The Agents then send that collected data to Data Processors, which parse the raw logs into relevant metadata. For any logs that meet certain criteria (immediate operational, security, or compliance relevance), the Data Processor categorizes those important logs as "Events." For more information, see the Understand the LogRhythm Architecture topic in the SIEM Help.
In the Web Console, you can view the following types of data:
- Events. The high-level data shown on the Dashboards page. Events typically include logs that indicate errors, failures, or attacks. Either the Data Processor or the AI Engine (if integrated) can classify a log as an event:
- MPE Events. Classified by the Data Processor's Message Processing Engine (MPE).
- AIE Event. Classified by the AIE's rules. Event data is displayed on the Dashboards in a variety of chart types.
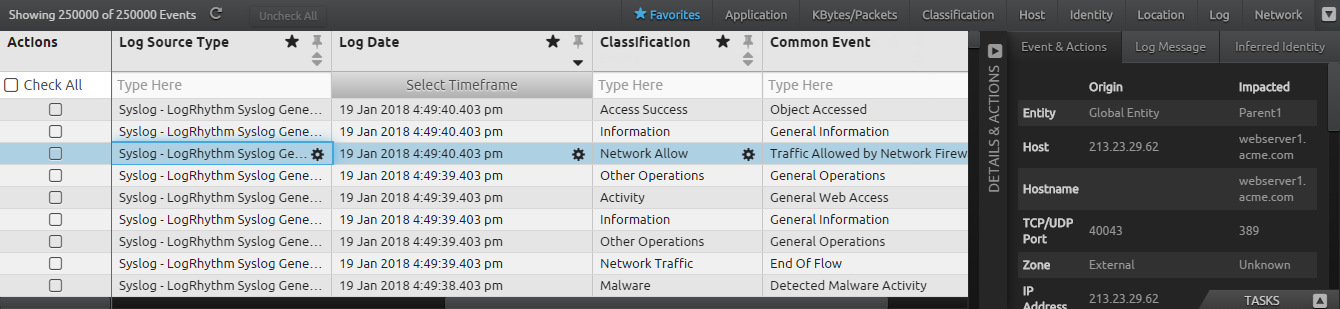
- Metadata. The parsed log data available in the Analyzer grid. Data Processors derive metadata from the raw logs, and when applicable, also add contextual information such as the known application or geographic location. Metadata can provide such information as impacted hosts, IP addresses, and origin of the data.
- Raw Logs. The unprocessed data sent from Agents. You can view the raw log by selecting an entry (row) in the grid and then clicking on the Log Message tab in the Details & Actions pane.
The Analyzer grid provides details on the log activities that generate events. Each line in the grid shows the metadata associated with a single event or log.