7.13.0 GA Release Notes - 29 June 2023
Introducing LogRhythm SIEM 7.13! In this version, we significantly improved processing performance with the System Monitor JSON Engine and Data Processor Pooling. Brief explanations of the updates are grouped into the following sections:
Key highlights include:
Sections on maintenance and upgrades:
We’ve updated our LogRhythm SIEM Documentation. You can now select documentation associated with a specific version (starting with 7.12.0). Click on the version picker in the upper-right corner on the SIEM and Installations and Upgrades landing pages.
Analyst Experience
SecondLook in Web Console
Customers want to retain their data, and they need an easy way to find their older data. With LogRhythm 7.13, customers who use our self-hosted SIEM option now have access to SecondLook. After installing and configuring SecondLook, customers can query data and search through archives directly from the Web Console. Without having to pivot between the Web Console and Client Console, customers save valuable time. Using SecondLook also means searches are passed off to a dedicated service for a more reliable user experience.
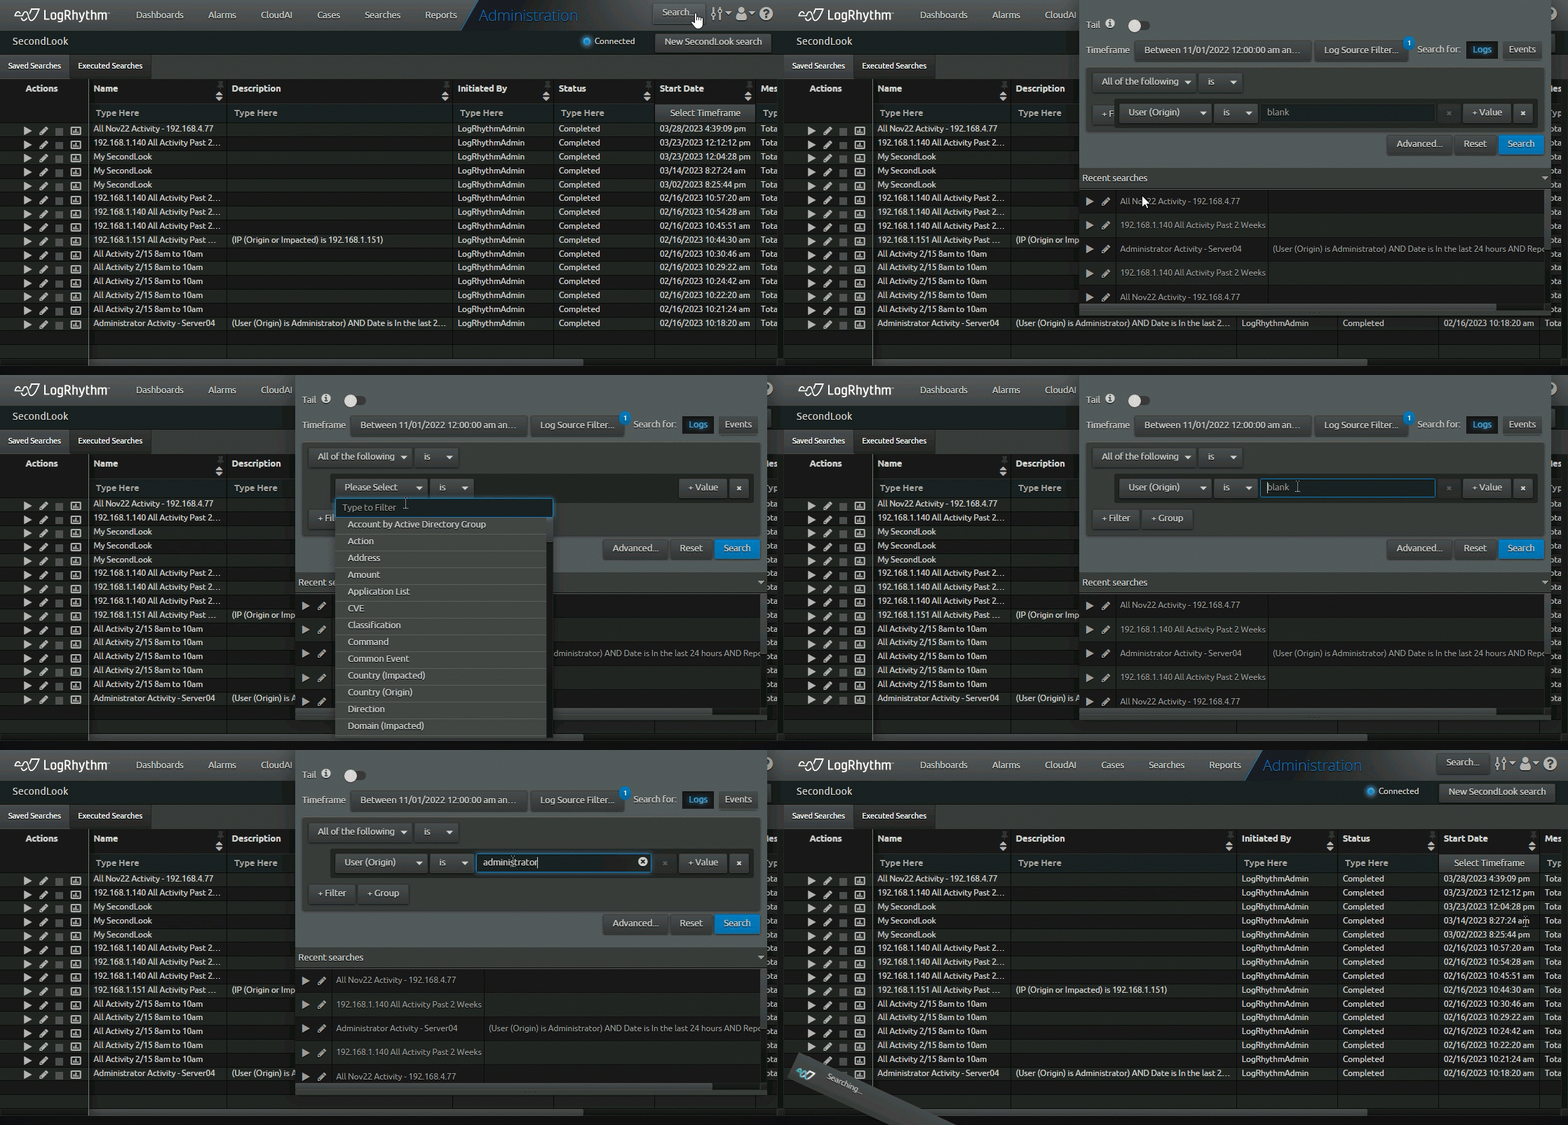
Initiating a SecondLook search.
For installation and configuration details, see Install SecondLook API.
Automation
With new features, come new REST API endpoints! LogRhythm 7.13 further extends the automation capabilities of the Admin API so that you can programmatically:
Configure, update, and retrieve System Monitor DP Pooling settings.
Configure, update, and retrieve System Monitor Load Balanced Group settings.
Configure, update, and retrieve log source Watch File Rename on Rollover settings.
For more details on all the available endpoints, see our REST API Documentation.
New to the API and wondering how to get started? Learn more on the Community!
Data Collection
Data Processor Pooling
Data Processor pooling makes it easy for administrators to distribute log volume across a pool of Data Processors and create well-balanced Data Indexer clusters. With DP pooling, administrators can quickly define DP pools and assign Agents to them. Agents then auto-distribute their logs across the DP pool. Administrators can also turn off DP pooling by switching an Agent to pinned mode.
System Monitor Agents are the workhorses that collect and ship data to Data Processors. But there was not a good way to load balance these System Monitor Agents across multiple Data Processors — until now.
With version 7.13, LogRhythm introduces Data Processor Pooling, a new feature that lets administrators define a pool of one or more Data Processors to allow a single Agent to collectively send its data to a group of Data Processors. When an Agent is assigned a DP pool, the Agent will spread the logs across the Data Processors. This removes the need to manually review Agent volumes and adjust which Data Processors the Agents are sending to, saving you time.
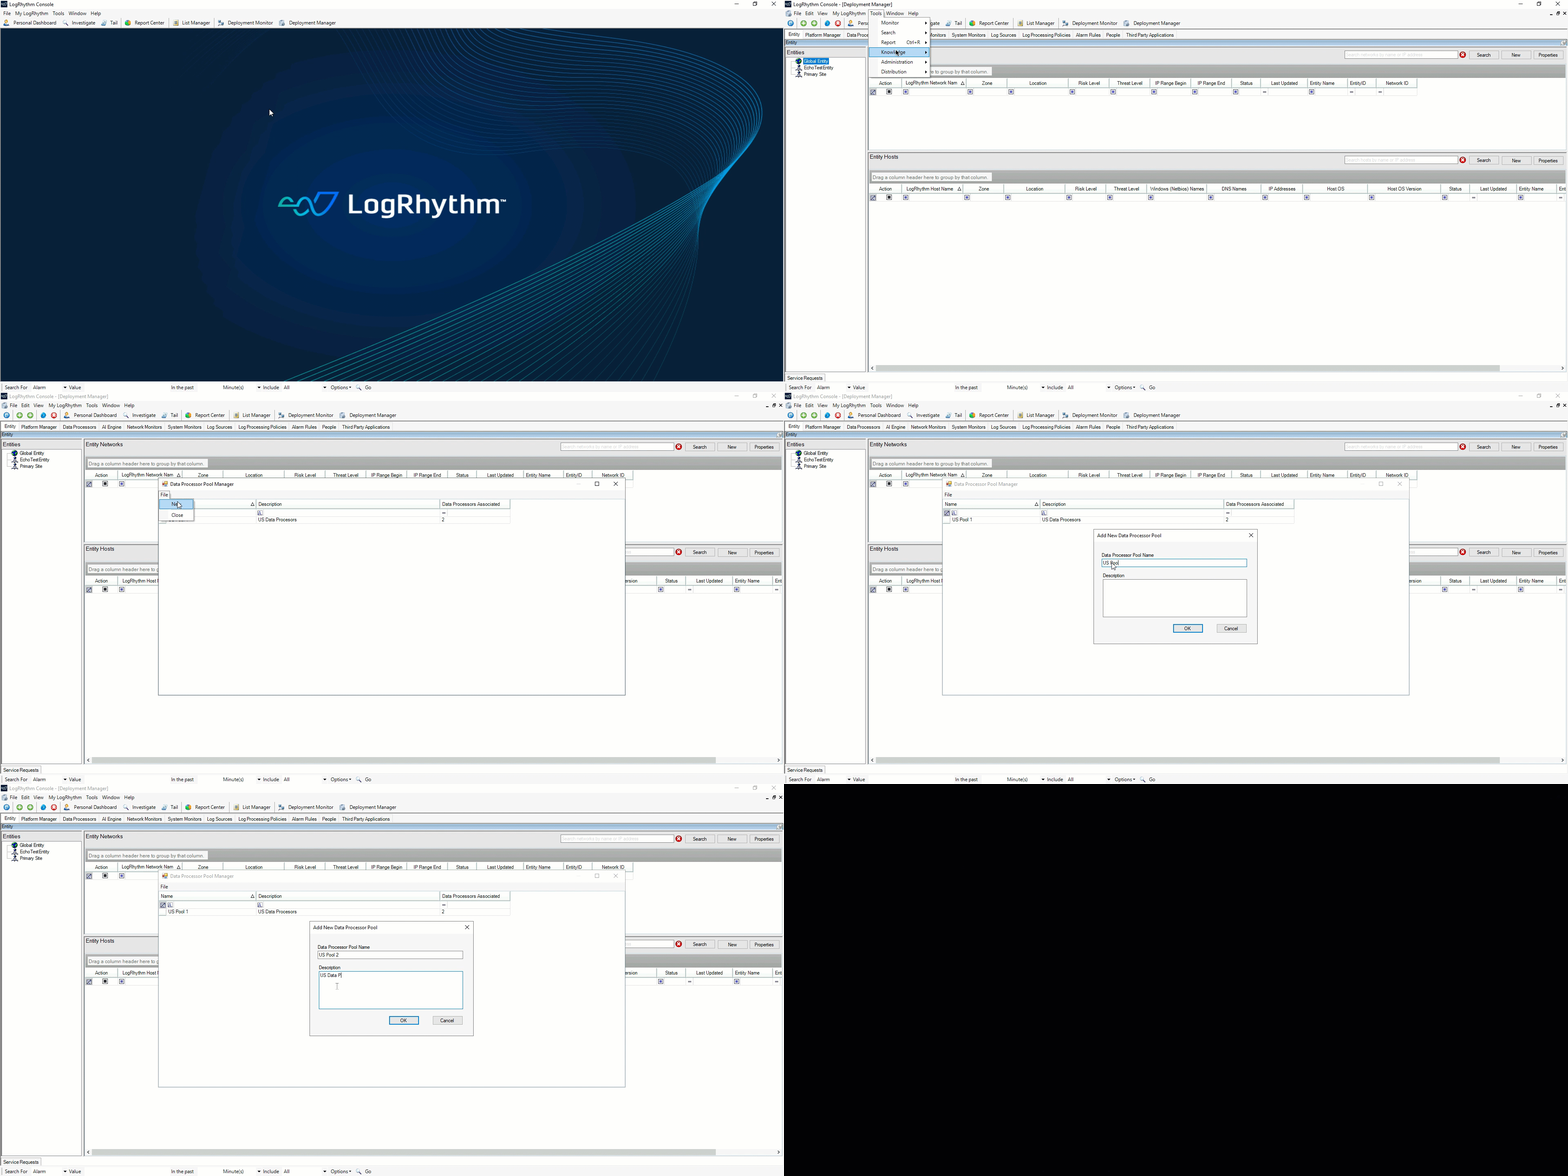
Defining a Data Processor pool.
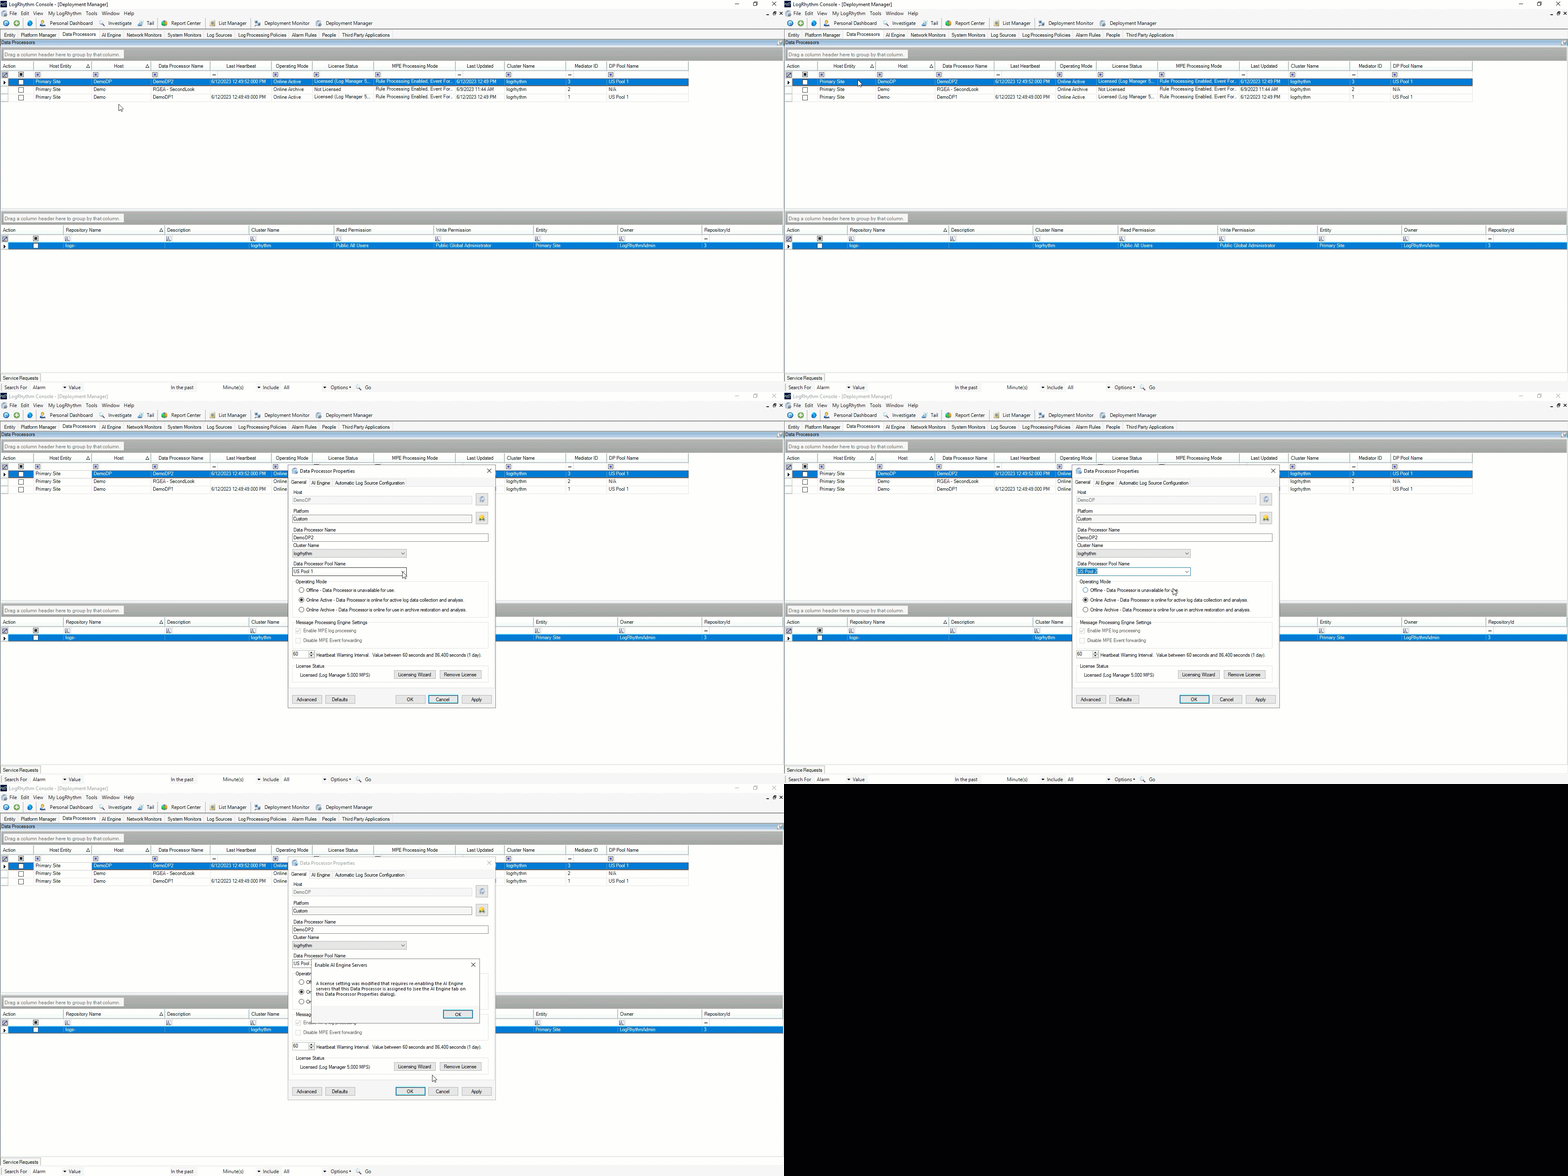
Assigning a Data Processor to a pool.
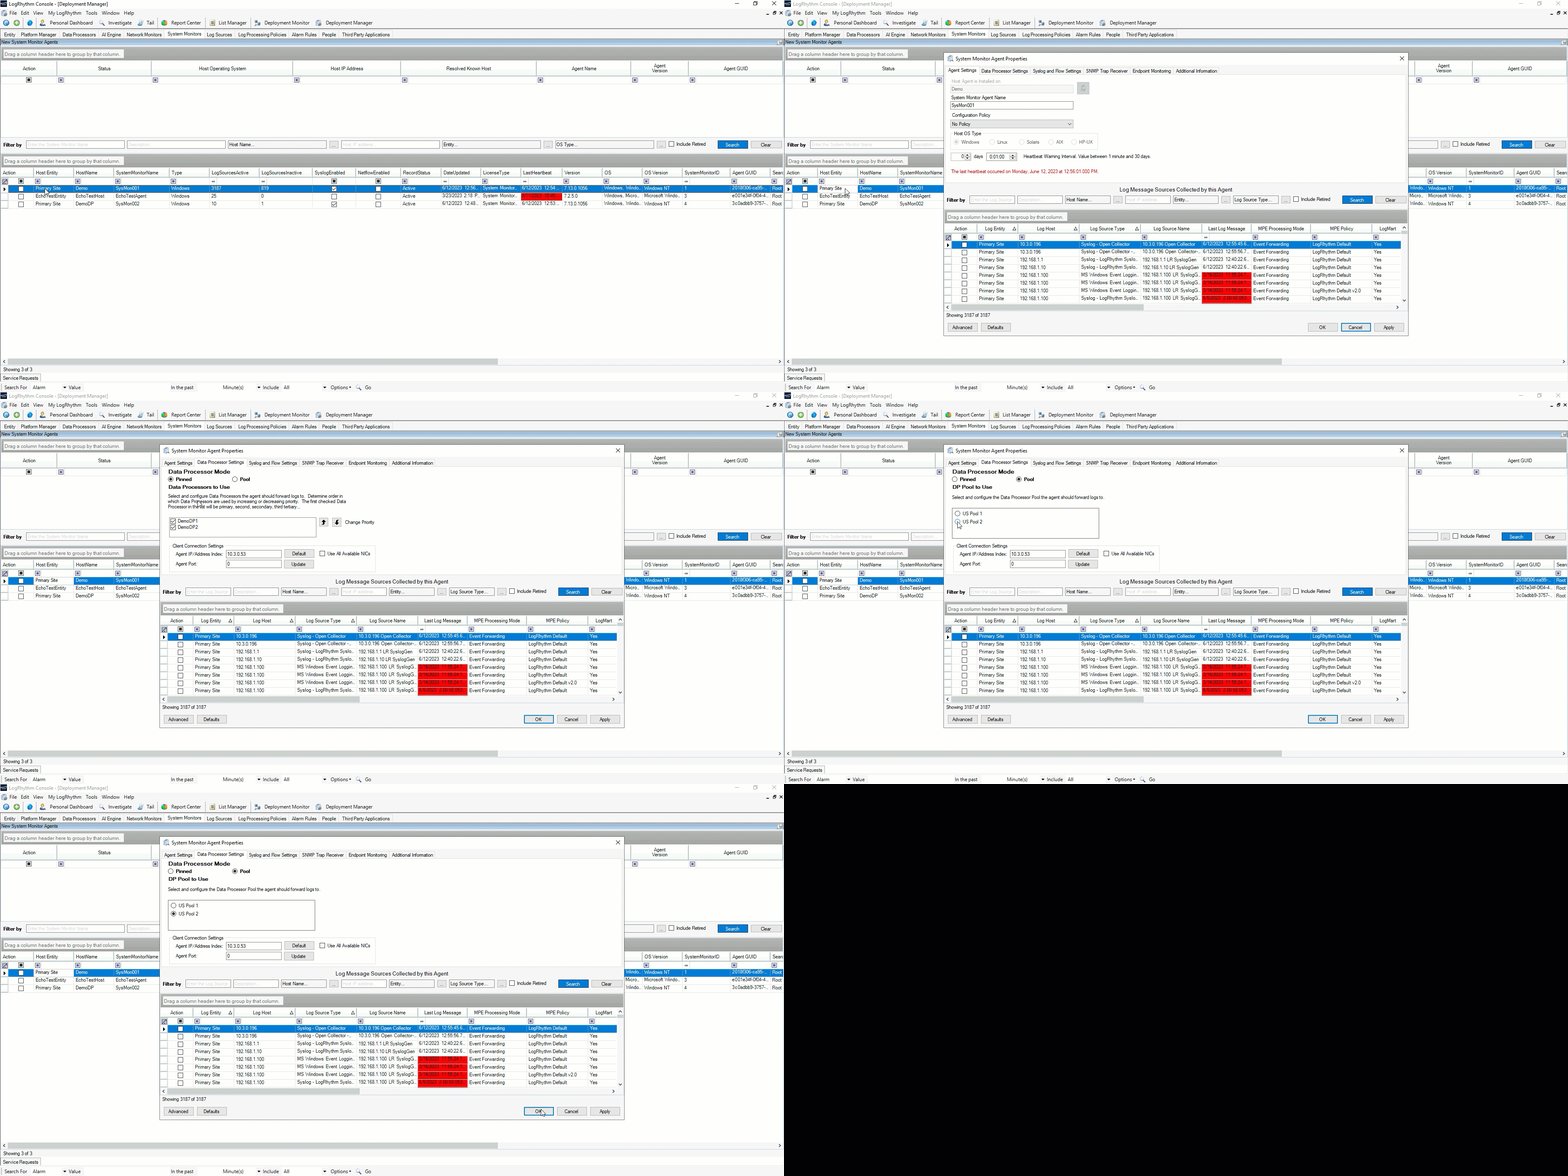
Assigning a System Monitor to a pool.
System Monitor JSON Engine
The 7.13 System Monitor is now embedded with a native JSON parsing engine. This significantly improves processing performance and removes the need to work with JQ query language. With the new architecture, Beats can be rerouted from the Open Collector parsing engine to the new parsing engine on the System Monitor. This simplifies sizing, deployment, and troubleshooting of the platform. For more information, see Configure Beats for JSON Parsing.

Enabling JSON parsing on a System Monitor Agent.
View System Monitor Agents in the Web Console
In the Web Console, global and restricted administrators now have an Agents option in the Administration menu.
On the Agents page, administrators can quickly check the status and health of System Monitors right in the Web Console. They can easily see a System Monitor's status and the timestamp of the last heartbeat received.
The Agents Grid shows a dynamic display of agents based on the access granted to the user.
Restricted administrators can only view the effective System Monitors defined in their user profile.
The Agents Grid helps administrators immediately identify problematic Agents with Last Heartbeat highlighting. In environments that contain thousands of Agents, admins can filter down to view just the Agents that matter. Filters include:
Name
Host
Entity
Type
Number of Log Source
Version
Status
Data Processor
Last Heartbeat
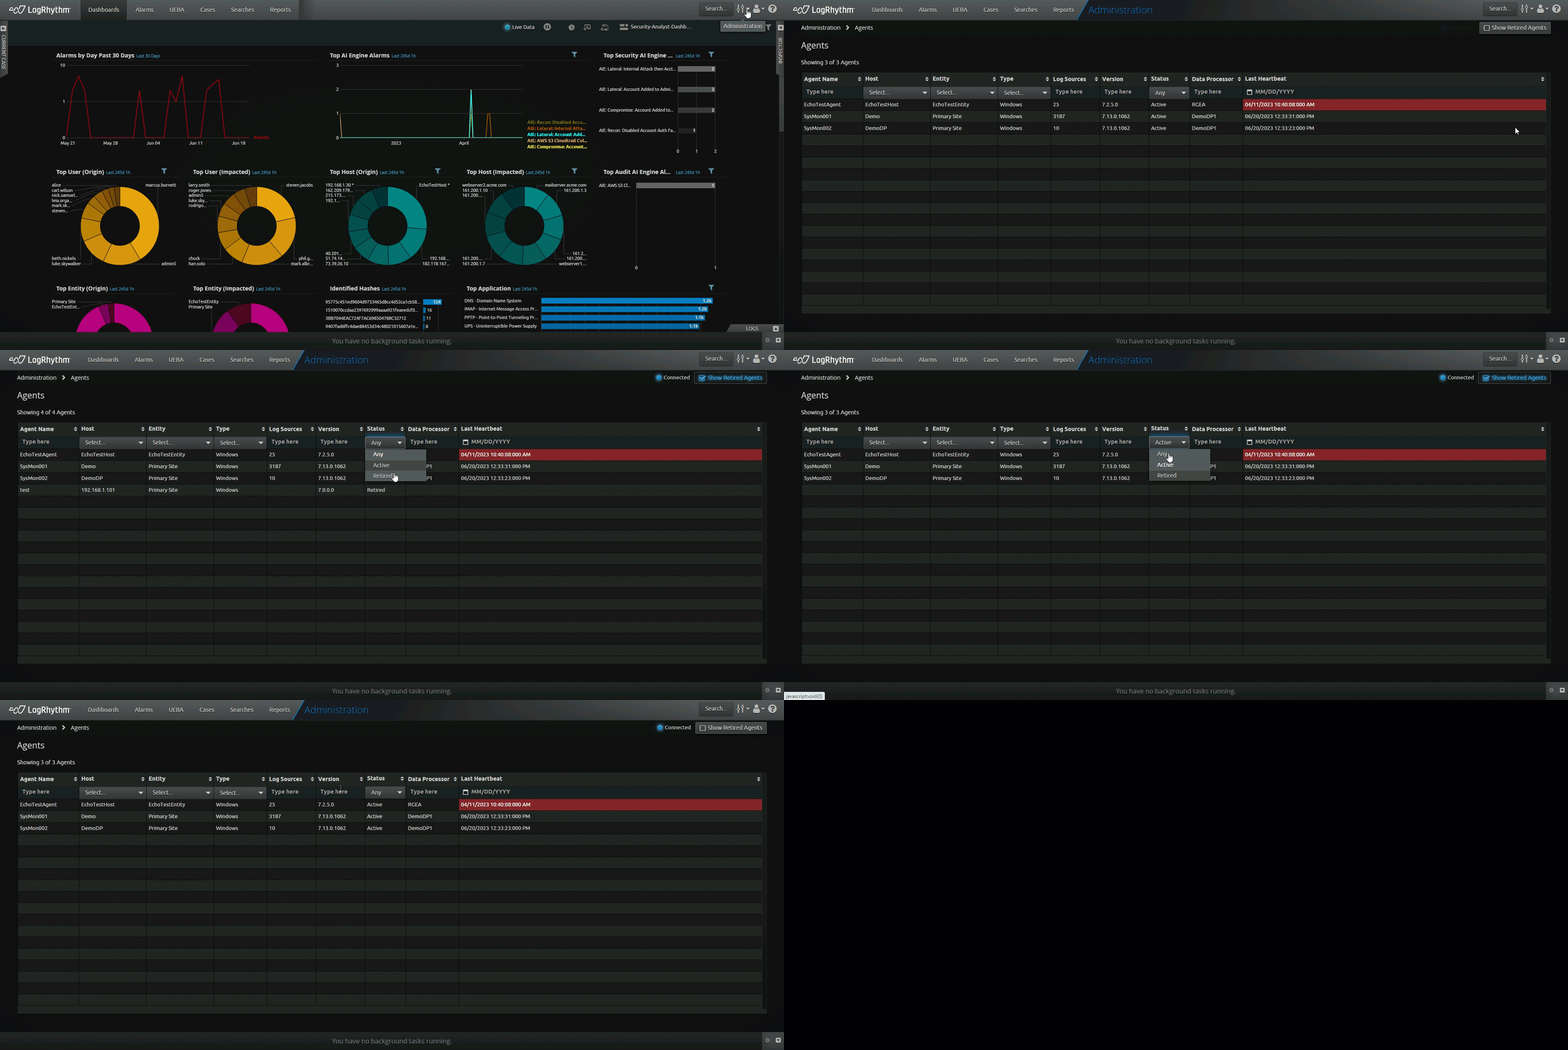
Applying a filter on the Agents Grid.
Platform
Over time, operating systems become outdated, making past versions unsupported. With the release of 7.13, LogRhythm is supporting and installing Microsoft Server 2022, Microsoft SQL Server 2019, and Rocky Linux. For customers that prefer the open-source version of Linux, Data Indexers and Open Collector support Rocky Linux 9 and RHEL 9. For customers with RHEL licenses, LogRhythm SIEM supports RHEL 9. For information, see the Component Operating System Support section in Review the Requirements for a New LogRhythm Deployment.
We’ve also added additional support for System Monitor, which includes Windows 2022, Windows 11, Rocky Linux 9, and RHEL 9. For information, see LogRhythm System Monitor Compatibility and Functionality.
Resolved Issues
Bug # | Component | Description |
|---|---|---|
ENG-11205 (DE16679) | Active Directory | Active Directory syncs no longer fail when a user account has two usernames. |
ENG-35407 | AI Engine | AI Engine rules no longer experience significant delays when firing in certain situations. |
ENG-22876 (DE16824) | APIs | Changing the alarm status in the Case API no longer results in an error in certain situations. |
ENG-11199 (DE16890) | APIs | Alarm Status update requests no longer fail in LRCloud deployments in certain situations. |
ENG-23824 | Client Console | The Deployment Manager option is no longer shown to Restricted Analysts. |
ENG-11160 (DE15875) | Client Console | LogMart maintenance now correctly reflects changes made to LogMart_TTL. |
ENG-24715 | Client Console | SSL/TLS can now be enabled on the Platform Manager Properties tab to prevent SSL/TLS notification failure. |
ENG-24954 | Client Console | The MaxMessageCount for a log source can now accept values up to 50,000. |
ENG-11141 (DE14874) | Reporting | The Log Volume by Log Source report's Bytes/Packets and Sent/Rcvd filters now execute successfully. |
ENG-31775 | SecondLook | The SecondLook API log no longer displays incorrect "Object reference" errors. |
ENG-36167 | SecondLook | Saving a SecondLook configuration with a retired log source no longer fails. |
ENG-34885 | SecondLook | SecondLook drill-downs and searches no longer give inaccurate results in certain situations due to local machine time zone discrepancies. |
ENG-34260 | SecondLook | The SecondLook API no longer produces an incorrect "out of memory" error in certain situations when executing a search. |
ENG-36544 | System Monitor | The AutoCorrectionMSEvtPosLogic flag is now OFF by default in the scsm.exe.config file to prevent unnecessary errors. |
ENG-34772 | System Monitor | Starting a System Monitor agent in "unidirectional mode" no longer produces a socket error in certain situations. |
ENG-22863 (DE14276) | Web Console | The Lucene filter now correctly filters time ranges. |
ENG-11143 (DE15241) | Web Console | The Web Console no longer crashes in certain situations when attempting to search by log source. |
ENG-11161 (DE15810) | Web Console | The time range filter now works correctly and populates widgets when applied to the trend chart. |
ENG-11140 (DE14882) | Web Console | The User (Origin), User (Impacted), and User (Identity) fields on widgets now correctly show results when the widget or dashboard timeframe is changed. |
ENG-11162 (DE16404) | Web Console | Location-based widget filters are now applied correctly. |
ENG-11192 (DE16711) | Web Console | The Dashboard navigation bar no longer appears abnormally large in the Google Chrome browser. |
ENG-23301 | Web Console | Web Console CSV exports of log investigations are no longer partially blank in certain situations. |
ENG-25994 (DE11929) | Web Console | Web Console Dashboard drill-downs now correctly abide by set filters. |
ENG-26562 | Web Console | CAC card authentication now correctly works for Web Console logins. |
ENG-30099 | Web Console | Custom time ranges no longer fail to work correctly on Dashboard widgets in certain situations. |
ENG-30493 | Web Console | The Web Console night mode cursor color has been changed so that it is visible at all times. |
ENG-32795 | Web Console | The Web Console night mode Lucene filter box has been changed to match the rest of the night mode UI. |
Resolved Issues - Security
Security-related issues resolved with this release are available for customers to view on the Community.
Known Issues
The following issues have each been found and reported by multiple users.
Bug # | Found In Version | Components | Description | Release Notes |
|---|---|---|---|---|
ENG-11165 (DE16414) | 7.9 | Client Console | Client console search queries including the Host IP Address criteria are timing out in large databases. | Expected Results: Log source searches should be completed without performance issues. Workaround: There is currently no workaround for this issue. |
ENG-22882 (DE10768) | 7.4.9 | Common Components | In certain circumstances, the Data Processor runs slowly and the non-paged pool uses significant system memory. This can cause a large unprocessed logs queue or other backlog in the system. | Expected Results: The non-paged pool should not increase and cause system performance issues. Workaround: Restart the LogRhythm API Gateway service. |
ENG-11108 (DE12153) | 7.6.0 | Common Components | In some cases after a Data Indexer install, the Service Registry may not be able to communicate with the Platform Manager, causing alarms and errors in the Service Registry log. | Expected Results: Communication to the Platform Manager should be maintained after an install. Workaround: Restart Service Registry on each node in the cluster after the installation is complete. |
ENG-22881 (DE12218) | 7.6.0 | Data Indexer | The Transporter can fail to fully start after restart at UTC midnight, causing indexing and performance issues. (This issue only impacts Linux clusters.) | Expected Results: The Transporter should continue to run after a restart signal is sent. Workaround: Restart the Transporter service. |
ENG-11175 (DE16040) | 7.6.0 | Data Indexer | Data is being indexed in lower case, ignoring the case of the original logs. | Expected Results: Data should be stored in the format in which it was sent. Workaround: There is currently no workaround for this issue. |
ENG-22862 (DE13480) | N/A | Data Indexer | Alarm drilldowns fail as a result of changes to daylight savings in Chile. The failure is temporary and only lasts a few hours. | Expected Results: Searching should work. Workaround: Either wait for the issue to naturally pass or manually adjust system clocks. |
ENG-11150 (DE15289) | N/A | Infrastructure | Weekday maintenance is taking much longer than expected. | Expected Results: The weekday maintenance task should perform in a reasonable amount of time. Workaround: There is currently no workaround for this issue. |
ENG-11173 (DE15601) | 7.9.0 | Installation Components | DR SQL transaction logs are filling the L: drive when unable to sync to secondary nodes. | Expected Results: Transaction logs should be truncated by frequent scheduled backups throughout the day. Workaround: There is currently no workaround for this issue. |
ENG-11142 (DE15089) | 7.9.0 | Metrics Collection | Telemetry metrics parsing errors from Datadog are present in the metrics collection file. | Expected Results: Datadog's telemetry metrics parsing errors should not be present in the metrics collection file. Workaround: There is currently no workaround for this issue. |
