General Deployment Requirements
The deployment of this module assumes the following:
-
The overall LogRhythm deployment is in a fully-deployed and healthy state.
-
LogRhythm version 7.2.1 or later is installed.
General Data Collection Requirements
When enabling the IT Operations Module rules in your environment be aware of the following considerations regarding data collection. Detailed data collection requirements are included in the IT Operations Module User Guide:
-
Endpoint logging is required for the majority of the monitoring rules to function.
-
This module leverages 3rd party monitoring software such as Nagios and Windows Performance Monitor that are required for some rules to function.
Logging and Monitoring Configuration
Configure Windows Audit PnP Activity Logging
A number of AIE Rules in the IT Operations module monitor for system configuration changes. By default, Windows will not log plug-and-play activity to the event log. This can be valuable information for tracking configuration changes that might impact system stability. It is recommended that Audit PnP Activity logging be enabled to enhance system configuration monitoring within the IT Operations module. Note that Audit PnP Activity logging is only available in Windows 10/Server 2016 and later.
Configuration steps for Audit PnP Activity Logging can be found here: https://docs.microsoft.com/en-us/windows/security/threat-protection/auditing/advanced-security-audit-policy-settings.
More information on Audit PnP Activity Logging can be found here: https://docs.microsoft.com/en-us/windows/security/threat-protection/auditing/audit-pnp-activity.
Configure Microsoft Windows Performance Monitor Event Logging and Collection
A Performance Counter Alert within User Data Collector Sets must be defined in Performance Monitor with three Performance Counters for the relevant AIE Rules to function. These must be defined according to the following criteria on each host you want to monitor. Create an Alert Type Data Collection set according to the instructions provided by Microsoft.
For assistance configuring Performance Monitor, see the Microsoft documentation here: https://docs.microsoft.com/en-us/previous-versions/windows/it-pro/windows-server-2008-R2-and-2008/cc722414(v=ws.10)
Set the Performance Counter Criteria
-
IT Ops: Perfmon: Dsk % Idle Time Blw Thrshld
-
\LogicalDisk(Desired Disk(s))\%Idle Time
-
Alert when: Select Below Limit and enter the threshold you want for the alert.
-
-
IT Ops: Perfmon: Low Free Disk Space
-
\LogicalDisk(Desired Disk(s))\%Free Space
-
Alert when: Select Below Limit and enter the threshold you want for the alert.
-
-
IT Ops: Perfmon: Proc Time Thrshld Exceeded
-
\Processor(Desired CPU(s) or core(s))\% Processor Time
-
Alert when: Select Above Limit and enter the threshold you want for the alert.
-
The Sample Interval for all counters can be left at the default of 15 seconds.
Set the Alert Action
Right-click the Data Collection Set to access the Alert Actions tab of the properties dialog box. Select the Log an entry in the application event log check box and click OK.
Add the Log Source to LogRhythm
Follow the instructions in the Add a Single Log Source topic in the LogRhythm SIEM Help to add the log source type MS Windows Event Logging - Diagnosis-PLA with the following parameters:
-
Log Processing Policy: LogRhythm Default
-
Flat File Settings File Path: Hostname:Microsoft-Windows-Diagnosis-PLA/Operational
Configure Nagios
Nagios is capable of monitoring host and service states. Four AIE rules have been created utilizing host and service monitoring. Nagios has the ability to monitor a wide range of systems. IT Ops: Nagios: Sys Off Following Win Update is dependent on a Windows system being monitored by Nagios. The remaining AIE rules do not have any dependency on the type of system monitored. Default Nagios monitoring configurations can be used; however, if you want to monitor specific services they can be defined in the Nagios configuration.
Rules and documentation were created based on Nagios XI monitoring.
Configure Dell Lifecycle Alarms for LogRhythm Appliances
Rules in this module rely on log data which is based on alerts from the Dell Lifecycle Controller, delivered via the Dell iSM utility. For these rules to work, you have to complete pre-configuration steps of installing the Dell ISM utility and enabling alerts to be sent to the OS Log (System for Windows and /var/log/messages for Rocky 9). LogRhythm Gen6 appliances will ship from the factory with alerts pre-configured and the Dell iSM utility already installed. For Gen5 and older appliances, you will need to perform the steps below.
Install Dell iDRAC Service Module Utility;
To get the latest version of the Dell iSM utility, access the Dell Support site, enter the service tag of your appliance, and search the keyword "iDRAC Service Module". If you have an appliance with CentOS 7, we recommend migrating to Rocky 9 prior to installing Dell iSM.
Windows Server 2016: https://dl.dell.com/FOLDER08068411M/1/OM-iSM-Dell-Web-X64-4.2.0.0-2581_A00.exe
Windows Server 2019/2022: https://dl.dell.com/FOLDER10276817M/1/OM-iSM-Dell-Web-X64-5.2.0.0-3156_A00.exe
-
Extract the contents to a folder.
-
Browse to iSM\windows folder and double click iDRACSvcMod.msi.
Rocky/RHEL 9: https://dl.dell.com/FOLDER10276844M/1/OM-iSM-Dell-Web-LX-5200-3156_A00.tar.gz
-
Extract the contents to a folder with tar -xvzf OM-iSM-*.tar.gz.
-
Browse to the folder and run the setup.sh for interactive installation of desired components
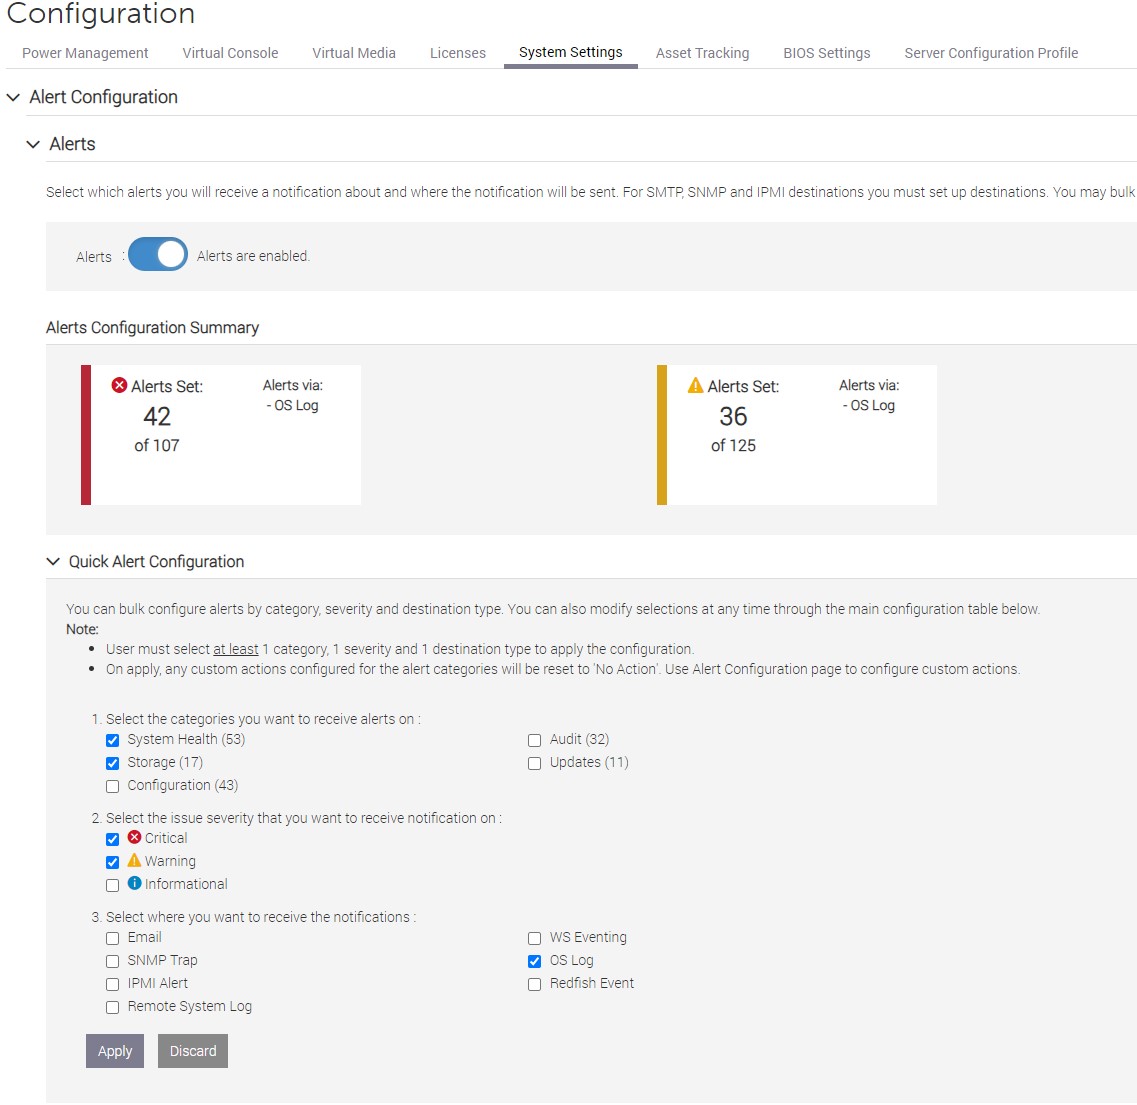
Configure Lifecycle Controller Alerts
Alerts can be configured a number of different ways. We recommend completing the configuration via the iDRAC interface. If you have installed the Windows version of the Dell iSM utility, you can access the local iDRAC through the OS by opening a browser to https://idrac.local. You can also access the iDRAC via the configured IP address for the dedicated iDRAC port.
-
Open the Configuration menu at the top.
-
Open the "System Settings" tab.
-
Expand the Alerts Configuration - At minimum it is recommended to configure the following:
-
Categories: System Health and Storage
-
Severity: Critical and Warning
-
Send Notifications to: OS Log
-
Import and Synchronize the Module
The IT Operations Module is part of the LogRhythm Knowledge Base (KB). Updating the KB automatically creates the proper AI Engine Rules.
Make sure the IT Operations Module is imported and enabled, as described in this section.
-
In the Client Console, click the Tools menu, click Knowledge, and then click Knowledge Base Manager.To open the Knowledge Base Manager, the Deployment Manager must be closed.
-
Under Knowledge Base Modules, find the IT Operations Module. If the module is available, IT Operations is visible in the grid.
If the module name does not appear, update the Knowledge Base by doing either of the following:-
Automatic Download. Click Check for Knowledge Base Updates, and then click Synchronize Stored Knowledge Base.
-
Manual Download. For manual download instructions, see the Import a Knowledge Base topic in the LogRhythm SIEM Help.
-
-
Locate the Enabled column in the grid.
-
If the box is checked, the Module is already enabled and available to users in the SIEM deployment.
-
If the Enabled box is not checked, enable the Module by selecting its Action check box, right-clicking the Module name, then clicking Actions, and clicking Enable Module. A dialog box appears to enable the selected module(s).
-
-
Leave the Enable Intelligent Indexing on Module Objects cleared unless you fully understand the effects of this setting. For more information, see the Intelligent Indexing topic in the LogRhythm SIEM Help.