Prerequisites
Before attempting these instructions, ensure the following criteria are met:
-
The LogRhythm SIEM is at version 7.1.4 or above.
-
The LogRhythm implementation includes the following: XM "all-in-one" SIEM, or Platform Manager (PM), Data Processor (DP), Data Indexer, AI Engine (AIE), and System Monitor
-
The Splunk Enterprise deployment is version 6.2.1 or above.
-
The LogRhythm SIEM and the Splunk Enterprise deployment must exist on the same network segment or are available to communicate over segments that can be routed.
-
LogRhythm is used for security analytics, monitoring, security intelligence, and incident management (e.g., Case Management, SmartResponse).
Splunk Collection Considerations
LogRhythm offers ingrained Splunk users the ability to keep their existing Splunk infrastructure while introducing LogRhythm into their environments to enable security analysis, monitoring, and incident management. In this certified solution, Splunk is in place and used for enterprise log/machine data collection, log management, and to search for IT related use cases. The customer uses Splunk’s user interface and tools for IT related use cases and uses LogRhythm’s user interface and tools for all security related use cases. This process makes the following assumptions:
-
Splunk is collecting and indexing log source data.
-
Splunk is forwarding a copy of the data to LogRhythm with the following settings:
-
Logs are forwarded over TCP/UDP 514.
-
The source Splunk Enterprise Server is configured as a “Heavy Forwarder.” LogRhythm does NOT support receiving syslog log data from a Splunk “Universal Forwarder.”
-
-
LogRhythm is properly configured to process and index the data.
-
The LogRhythm System Monitor is listening for incoming syslog using the correct port and protocol.
-
The LogRhythm AI Engine is deployed.
Splunk to LogRhythm Data Feed
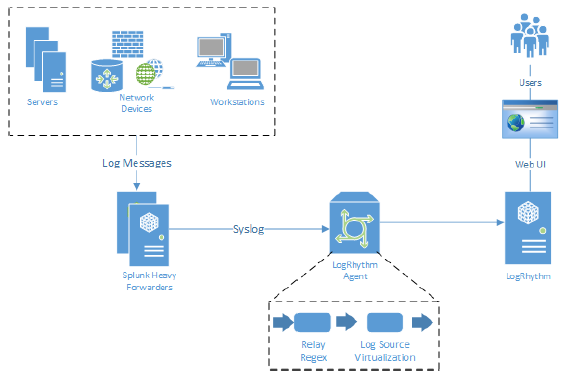
The Splunk to LogRhythm data feed is handled over syslog. Splunk Enterprise Servers can be configured as “Heavy Forwarders” to forward RFC 5424 compliant syslog to LogRhythm System Monitor Agents. All logs received by Splunk are redistributed over syslog to a receiver, which is the LogRhythm System Monitor. The format of the raw logs received depends on whether the original log source is a syslog or a non-syslog source.
It is recommended that you use a dedicated System Monitor to receive Splunk logs. This helps ensure that the System Monitor can keep up with the overall log volume of forwarded Splunk log sources. If one System Monitor cannot handle the Splunk log volume, LogRhythm recommends using a load balancer or configuring Splunk to split the outputs to more than one System Monitor. This is not a requirement. Other LogRhythm Log Sources can be collected on the System Monitors configured to collect forwarded Splunk logs.
All sources (including non-syslog sources) received from Splunk show up as one log source unless you configure LogRhythm System Monitors to identify the originating source of the logs using syslog relay regex. Specific relay regex and examples will be supplied for well-known collection types. At a minimum, the following tags should be used for any custom relay regex (see System Monitors for more information):
-
timestamp
-
host identifier
-
message
You may also need to configure Log Source Virtualization to split the originating sources into their respective log source types (e.g., Cisco ASA, Linux host, or Windows App, Security, and System logs)
Syslog Timestamp Parsing
The Windows System Monitor supports parsing log normal time from syslogs rather than using the collection time (syslog receive time) as the log normal time. Currently, the System Monitor only parses out host identifier information from syslogs using the regular expressions specified in the System Monitor's Syslog Relay Regular Expressions field. This functionality allows full time-stamp parsing including the following fields:
-
Month
-
Day
-
Year
-
Hour
-
Minute
-
Second
-
Millisecond
-
AM/PM
-
Time zone
When processing a syslog source, the System Monitor attempts to parse out the time stamp embedded in the syslog message and uses that value as the collection time (normal message date) for the log rather than the time when the System Monitor received the syslog from Splunk. If no time stamp can be parsed from the syslog message, the collection time (the time the log was received on the System Monitor’s syslog interface) is used as the normal message date.
In the following examples, the System Monitor uses Feb 19, 2015 4:09:18 (UTC) as the normal message date (versus the collection time) and 192.168.3.131 as the host identifier (rather than using the syslog relay host — the Splunk forwarder). If the year is not present in the syslog message, then the current year is used. If no time zone (UTC offset) is present in the syslog message, then the current time zone is used.
-
SPLUNKSERVER 192.168.3.131 - admin [19/Feb/2015:11:09:18.718 -0700] "GET /en-US/SPLUNKd/__raw/servicesNS HTTP/1.1" 200 192 "http://192.168.3.81:8000/en-US/app/search/search" "Mozilla/5.0 (Windows NT 6.3; WOW64) AppleWebKit/537.36 (KHTML, like Gecko) Chrome/40.0.2214.111 Safari/537.36" - 4ms
-
Mar 31 22:47:32 192.168.0.4 Feb 19 11:09:18 192.168.3.131 EVID:0041 ICMP Netflow UserPC6:40016->192.168.1.3:443 Bytes In: 125 Bytes Out: 226 Packets In: 2 Packets Out: 4
Custom MPE Log Processing Rules for Non-Syslog Sources
When non-syslog sources are forwarded from Splunk, a syslog header is added and, in most cases, the logs are formatted differently than if the same log were collected using the LogRhythm System Monitor. Because of this, the standard MPE rules for a log source will not work with the syslog wrapper. New custom log source type MPE rules may be needed to ignore the syslog wrapper and extract the log information.
API and flat file sources forwarded from Splunk may also be formatted or structured differently than what LogRhythm expects. In these cases, new MPE rules will be required to parse the log source correctly.
Forward Splunk Logs to LogRhythm
Assuming that logs received from Splunk are in a format that can be efficiently parsed and a custom MPE Policy is written to parse those logs, any log source type can be supported. At the time of the last update to this solution, the following log source types have been validated:
-
Syslog - Other
-
Syslog - Cisco ASA
-
Syslog - Snare Windows 2008 Event log
-
Syslog - MS Windows Event Logging XML – Security
-
Syslog - MS Windows Event Logging XML – System
-
AWS
-
Nessus
-
Netflow
-
eStreamer
-
Check Point
Non-syslog log source types are listed in the Deployment Manager's Log Processing Policies tab with the string “splunk” in the name field.
O365 Logs are not supported as a Splunk Forwarded log source. This is due to their complex JSON format, which causes poor processing performance. LogRhythm Recommends configuring O365 collection directly, using the LogRhythm System Monitor. See Microsoft Office 365 Log Collection for more information.
The API-based log sources listed above can also be configured directly using the LogRhythm System Monitor.
Configure the LogRhythm System Monitor
-
Enable Syslog Server on the LogRhythm System Monitor. By default, the System Monitor listens on TCP and UDP 514.
-
Delete ALL default syslog relay regular expressions and replace them with the following regex:
^<(?<priority>\d{1,3})>\s*(?<message>(?<month>[a-zA-Z]{3})\s*(?<day>\d{1,2})\s*(?<hour>\d{1,2}):(?<minute>\d{1,2}):(?<seconds>\d{1,2})\s*<(?<hostidentifier>\S+)\s*MSWinEventLog\t.*) ^<(?<priority>\d{1,3})>\s*(?<message>[^<]*(?:<[^>]+>[^<]*)*<computer>(?<hostidentifier>[^<]+)</computer>.*) ^<(?<priority>\d{1,3})>\s*(?<message>(?<month>[a-zA-Z]{3})\s*(?<day>\d{1,2})\s*(?<hour>\d{1,2}):(?<minute>\d{1,2}):(?<seconds>\d{1,2})\s*Message forwarded from (?<hostidentifier>\S+):.*) ^<(?<priority>\d{1,3})>\s*(?<message>(?<month>[a-zA-Z]{3})\s*(?<day>\d{1,2})\s*(?<hour>\d{1,2}):(?<minute>\d{1,2}):(?<seconds>\d{1,2})\s*(\S+:)\s*.*) ^<(?<priority>\d{1,3})>\s*(?<message>(?<month>[a-zA-Z]{3})\s*(?<day>\d{1,2})\s*(?<hour>\d{1,2}):(?<minute>\d{1,2}):(?<seconds>\d{1,2})\s*(?<hostidentifier>\S+)\s*.*) ^<(?<priority>\d{1,3})>\s*(?<message>.*) ^(?<message>(?<month>[a-zA-Z]{3})\s*(?<day>\d{1,2})\s*(?<hour>\d{1,2}):(?<minute>\d{1,2}):(?<seconds>\d{1,2})\s*(?<hostidentifier>\S+)\s*.*)>\S+)\s*.*)
If the source host is not correctly identified while performing the acceptance steps for your forwarded sources, you may need to add a custom Relay Regex to parse the correct host identifier based on the log's format. See System Monitors for more information about configuring the above values.
Add the Splunk Server’s Local Logs
-
Configure the Splunk var/log directory as an input on the Splunk Server sending logs to the LogRhythm System Monitor.
-
Accept new log sources into LogRhythm as a Syslog – Other log source type.
-
Run a tail or investigation to ensure proper processing and indexing of logs.
Add a Forwarded Syslog Source
-
Configure the Splunk Server to forward sources to the LogRhythm System Monitor.
-
Accept the new log sources and assign them to the log source type that matches the original source.
-
Run a tail or investigation to ensure proper processing and indexing of logs.
Add a Forwarded Windows Event Log Source
-
Configure the Splunk Server to forward sources to the LogRhythm System Monitor.
Splunk must be configured to send only the XML contents of the log and remove the non-essential metadata that is added by Windows. Doing this will reduce the size and complexity of logs, optimizing them for storage and collection. This is similar to LogRhythm’s support for Windows SLIM collection. For more information, see the Windows Slim Tips and Tricks Video on the LogRhythm Community. -
Accept new log sources into LogRhythm as a Syslog – Other log source type.
-
Create virtual log sources for each new parent log source to split up Application, Security, and System Events logs into their own source (see
for details about how to complete the following steps):
-
Create three virtual log sources.
The policy for Windows Application Event logs is currently under development, so we will use a Log Source Type of “Syslog – Other” to process the logs. This will limit parsing, but most searches can be accomplished by running a Web Console unstructured search against the log message field. See the Web Console User Guide for more information.
-
Create a new Log Source Virtualization template and add the three new virtual log sources to it.
-
Enable the virtual log sources on each parent source accepted in step 2 above.
For more information about enabling this for multiple parent log sources at one time, see .
-
-
Run a tail or investigation on the newly created parent and virtual log sources to ensure proper processing and indexing of logs.
Add a Windows Snare Syslog Source
-
Configure Splunk to forward sources to the LogRhythm System Monitor.
-
Accept the new log sources into LogRhythm as the appropriate log source type: Syslog - Snare Windows 2008 Event Log or Syslog - Snare Windows 2003 Event Log.
Snare does not require virtual log sources because the policies are built to parse Application, Security, and System event logs.
-
Run a tail or investigation to ensure proper processing and indexing of logs.
Add an API or Forwarded Flat File Source
-
Search for an existing Log Processing Policy for your forwarded source.
-
In the Name Field of the Deployment Manager's Log Processing Policies tab, search for splunk.
-
If a policy exists, you will see your source type in the resulting list. If a policy does exist, you will need to contact Support and open a request for new device support.
For more information, see Custom MPE Log Processing Rules for Non-Syslog Sources.
-
-
When you have identified a Log Processing Policy, configure the Splunk Server to forward the sources to the LogRhythm System Monitor.
-
Accept the new log sources, assigning them to the Log Source Type that matches the original source.
-
Run a tail or investigation to ensure proper processing and indexing of logs.
Send LogRhythm Alarms to Splunk
Before starting the procedures in this section, ensure that the following prerequisites have been met:
-
A separate index named LogRhythm has been created in the Splunk deployment.
-
The LogRhythm deployment is configured with AIE and AIE rules are enabled.
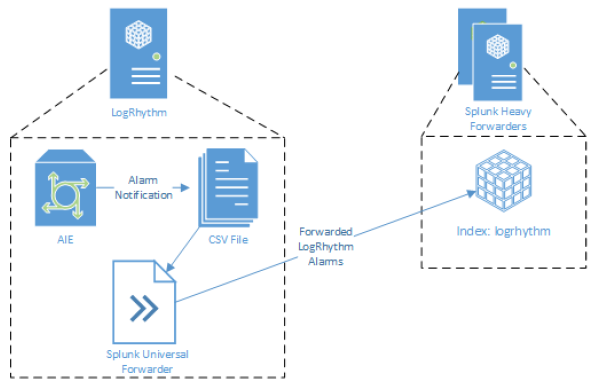
Install and Configure the Splunk Universal Forwarder
In this configuration, LogRhythm requires the Splunk Universal Forwarder.
-
Create a directory on the D: drive of the LogRhythm Platform Manager named SPLUNK_Output.
This directory is used to store log files forwarded from the Splunk deployment. -
Download and install the Splunk Universal Forwarder on the LogRhythm PM with the following configurations:
-
Use the default installation path.
-
Use the default Local System user.
-
Set the Receiving Indexer IP and Port according to your Splunk Environment.
-
The Path to Monitor should be set to the D:\SPLUNK_Output directory on the LogRhythm PM.
-
-
Install the Splunk Add-on for Microsoft Windows. See this page for more information.
Edit the input.conf File
-
Go to C:\Program Files\SPLUNKUniversalForwarder\etc\apps\SPLUNK_TA_windows\local.
-
Open input.conf with a text editor.
-
Locate the [monitor://D:\SPLUNK_Output] section.
-
Under disabled = false, insert a new line and add index = logrhythm.
-
Save and close the file.
Restart the Splunk Service
After adding the logrhythm index to input.conf, you must restart the Splunk service.
-
Start the Services App/Control Panel as an Administrator.
-
Locate the SplunkForwarder Service.
-
Right-click the SplunkForwarder Service, and then click Restart.
-
After the SplunkForwarder Service restarts, close the Services App/Control Panel.
Create a LogRhythm Distribution Policy to Send Alarms to a Text File
Only Global Admins or Restricted Admins with elevated View and Manage privileges can take this action.
-
In the Client Console on the main toolbar, click Deployment Manager.
-
On the Tools menu, click Distribution, click Notifications and Collaboration, and then click Notification Policy Manager.
The Notification Policy Manager window appears. -
On the File menu, click New Text File Policy.
-
When the Create Public Policy? dialog appears, click Yes to continue.
The Text File Notification Policy window appears. -
In the Policy Name box, type a name for the policy.
-
If you want to add a description for the policy, type it in the Brief Description box.
-
Set the base file path to D:\SPLUNK_Output\.
Ensure that the trailing "\" is included in the file path.
-
For Field Delimiter, select Comma from the list.
-
Under Include Alarm Fields and First Message Fields, select the check boxes for all of the fields you want to include in notifications, and clear other check boxes as appropriate for your infrastructure.
-
Click OK to save your changes.
Create a New User and Apply the New Distribution Policy
Only Global Admins or Restricted Admins with elevated View and Manage privileges can take this action.
To apply the text notification policy, you need to add a new person record.
-
In the Client Console on the main toolbar, click Deployment Manager, and then click the People tab.
-
On the File menu, click New.
-
When the Is Person an Individual? message appears, click Yes to continue.
The Person Properties (Individual) window appears. -
Type a name for the user that identifies it as the Splunk log collector.
-
Click the Contact Method Type list, and then click Text File.
-
Click the ellipses button [...] next to Alarm Notification Policy and select the Splunk text file notification policy that you just created.
-
Click OK, then click OK again.
You must add the new user manually to each AIE rule that forwards to Splunk. For more information, see .
Check the LogRhythm Alarms Output File
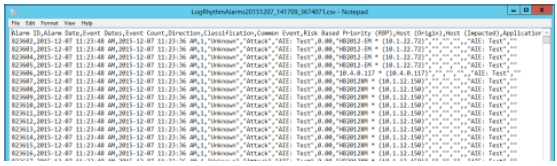
After completing the installation and configuration steps above and starting the Splunk Universal Forwarder, the LogRhythm AI Engine logs activity to a .csv file. When the file reaches 1,001 KB in size, the LogRhythm Text File Policy automatically creates a new file. The Universal Forwarder automatically moves to the next file in sequence as it is updated.
To verify the proper configuration:
-
Go to the D:\Splunk_Output directory.
-
Open LogRhythymAlarmsxxxxxxxx_xxxxxxx.csv with a text editor.
If data processed by AI Engine meets the selected criteria, the file contents should look similar to the following example: