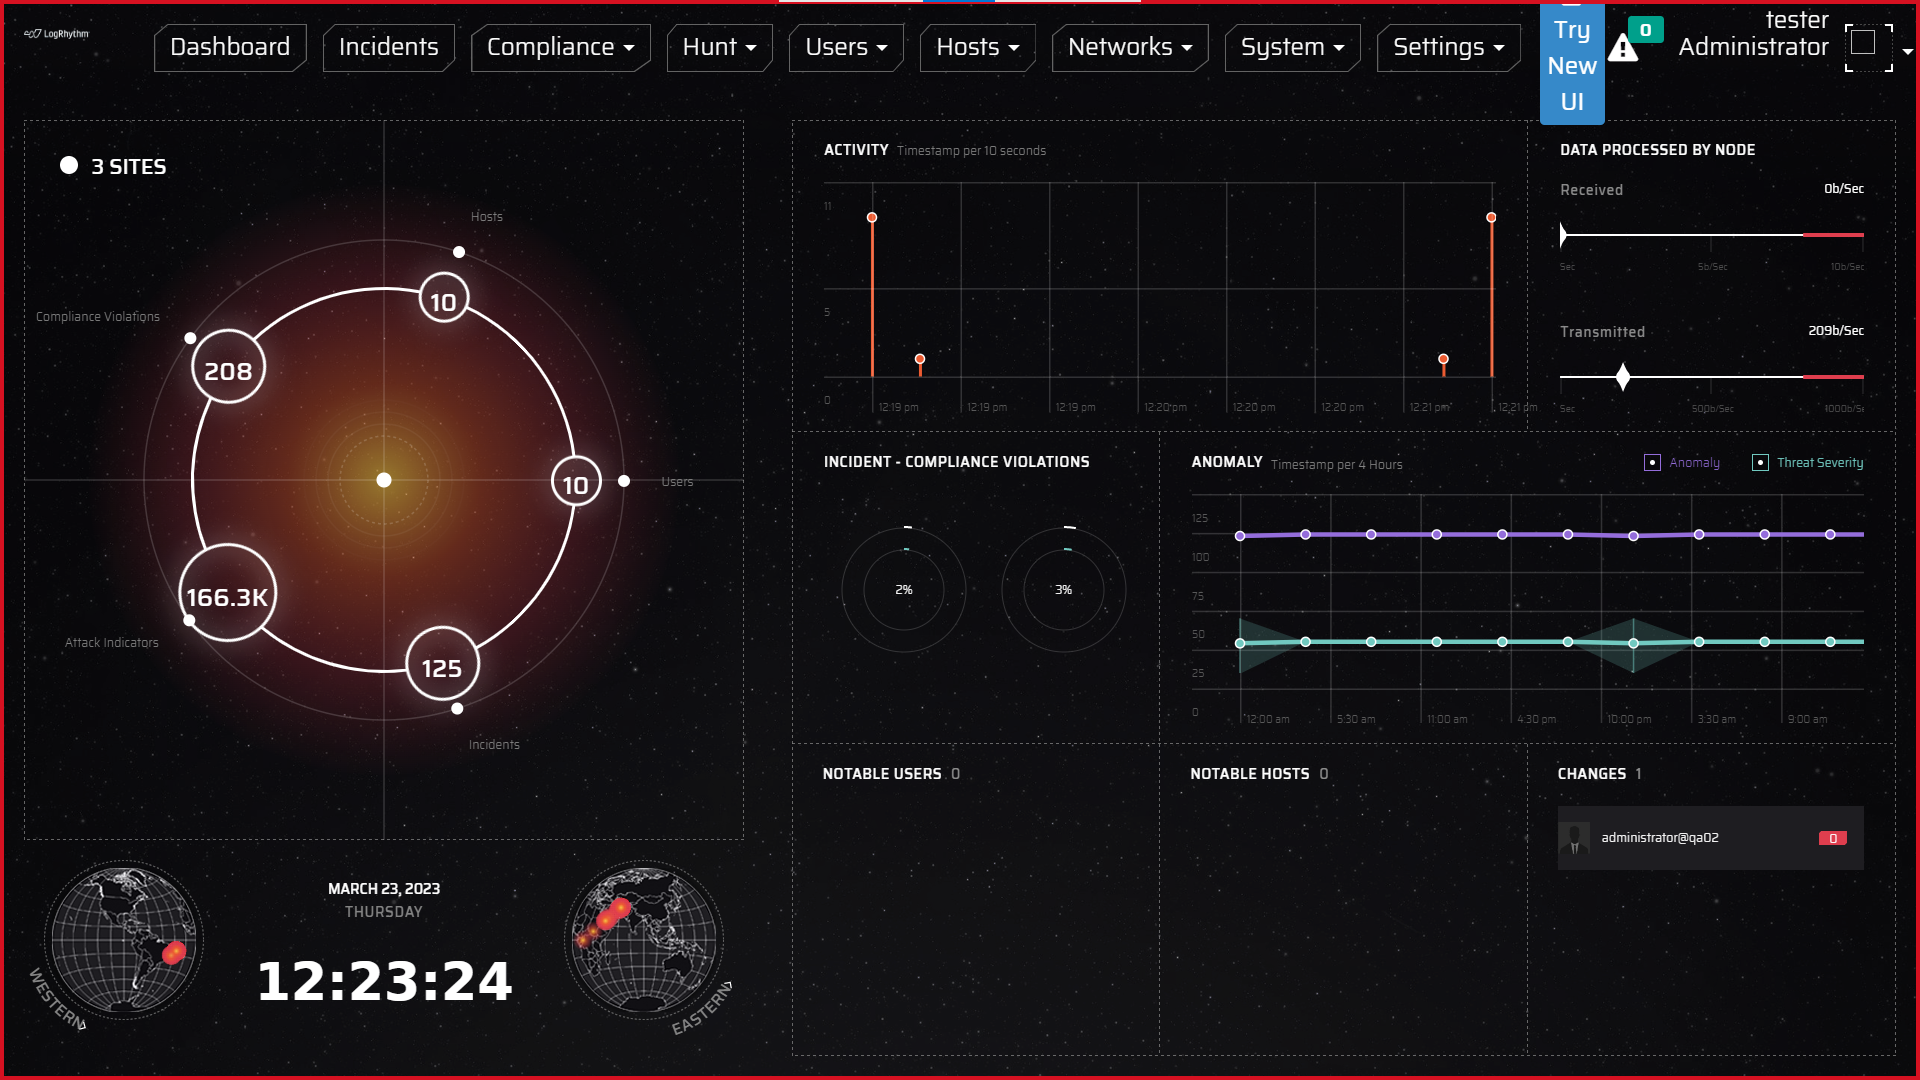
When analysts log in to LogRhythm NDR, the Main Dashboard is the first screen they see. The Main Dashboard provides an overview of their environment with actionable, real-time data.
Main Dashboard Sections
|
Section |
Location |
Description |
|---|---|---|
|
Main Menu |
Along the top of the screen |
Click a tab to navigate to other pages. |
|
User Icon |
Upper right-hand corner |
Click the icon to perform user actions. |
|
Site Radar Map |
Upper left-side |
A circular diagram depicting all the sites connected to LogRhythm NDR. Actionable points of interest are organized into five groups on the radar:
|
|
Network Traffic |
Upper right-side |
Two charts showing network activity over time (Activity) and the data transmitted and received (bits/sec) by the established connections on the network (Data Processed by Node). The Data Processed by Node chart does not reflect real-time data. Because of indexing limitations, the data displayed is about 10 minutes old.
Data Processed by Node calculations:
|
|
Recent Indicators of Compromise |
Middle right-side |
A real-time view of activity over the last four hours, focusing on four specific indicators of compromise:
|
|
Notable Entities and Changes |
Lower right-side |
Prioritized lists of users, hosts, and changes based on the number of incidents they are associated with. |
|
Geolocation Overview and Date/Time |
Lower left-side |
Hotspot maps of the Eastern and Western hemispheres show where activity is occurring. The current date and time is displayed between the two hemispheres. |