
Verify the Web Console Connection Status
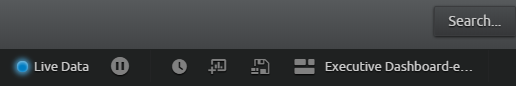
When you are logged in to the Web Console, you can verify its connectivity to the Web Console server. On the upper-right side of the Web Console, a status indicator displays "Live Data" with a blue dot next to it. If the Web Console cannot establish a connection, the status indicator displays "Reconnecting" or "Disconnected." When the Web Console is connected, any Processing Rate gauges, Trend charts, or Top X controls displayed on the Dashboards page updates automatically, unless you pause the live data stream.
Pause the Live Data Stream
At times, you may want to temporarily pause live data from streaming into the Web Console. For example, if alarms are triggering at a rapid pace, you may want to pause the connection so that new alarms do not push out previous alarms. This allows you time to investigate an issue. When you are ready to receive live data again, you can restart the data connection. All data is queued in the indexer cache and available when you resume.
The pause function is only applicable to the currently displayed page. For example:
- If the Alarms page is displayed, the Pause button stops new alarm cards from displaying.
- If the Dashboards page is displayed, the Pause button stops live data from updating any processing rate gauges, trend charts, and TopX controls.
To use the Pause and Resume function:
- In the upper-right of the screen, near the status indicator, click the Pause icon to pause the live data stream.
The icon changes to a Resume icon. No live data is lost. It remains in the indexer cache until you are ready to receive it. Click the Resume icon to resume the live data stream.
Logging off and back in to the Web Console also resumes the data stream.