Investigator
The powerful LogRhythm Investigator search tool allows you to view logs and events collected in near-real-time from both the Data Processor and Platform Manager Databases. Investigator default settings are configured in My Preferences.
Investigation Views
After you run an investigation, LogRhythm offers a rich set of grids, graphs, and charts to view the collected data. The initial search results window that appears depends on the type of search that was run. Results from Platform Manager and Data Processor searches appear in a window with two primary tabs, Log/Event Analyzer and Log Viewer, with additional views available from the Properties window under the File menu on the toolbar. Results from a Log Miner search appear in several different panes. A screen tip displays a definition of any column heading when you point to it.
Log/Event Analyzer Tab
The Log/Event Analyzer tab allows you to view aggregate statistics from the following tabs and sub-tabs, which are located at the bottom of the window. On the Tool Selector, the active view(s) are in boldface type. In Platform Manager and Data Processor searches, the Tool Selector appears on the left side of the screen.
| Tab | Purpose |
|---|---|
Aggregate Log/Event List | Logs with the same value for each of the primary metadata fields. |
Logs/Events by Time by Type | Logs/events for each type over the specified time frame. |
Logs/Events by Time by Direction | Logs/events for each Direction over the specified time frame. |
Logs by Day and Hour | Graphic display of logs by hour within day. |
Logs by Day of Week and Hour | Graphic display of logs by hour and day within week. |
| Logs/Events by Type | A pie chart that displays the number of logs/events for each Type of Audit, Operations, Security, and Unknown. |
| Logs/Events by Direction | A pie chart that displays the number of logs/events for each direction. |
| Audit Logs/Events by Classification | A bar chart that displays the number of logs/events for each Audit classification. |
| Operations Logs/Events by Classification | A bar chart that displays the number of logs/events for each Operations classification. |
| Security Logs/Events by Classification | A bar chart that displays the number of logs/events for each Security classification. |
| Log Source Statistics | A grid of Log Source statistics with a graph of the selected row. |
| Common Event Statistics | A grid of statistics for log/event Common Event and a graph of the selected row. |
User (Origin) Statistics | Provides log statistics for each recorded User Origin. All statistics tabs include the following subtabs: Logs by Time, KBytes by Time, Packets by Time, User (Origin) by Logs, Host (Impacted) by KBytes (iHost Total), Host (Impacted) by Packets (iHost Total). |
Host (Origin) Statistics | Provides log statistics for each recorded Origin Host. |
Host (Impacted) Statistics | Provides log statistics for each recorded Impacted Host. |
Application Statistics | Provides log statistics for each recorded Impacted Application. |
Vendor Message ID Statistics | Provides log statistics for each recorded Vendor Message ID. |
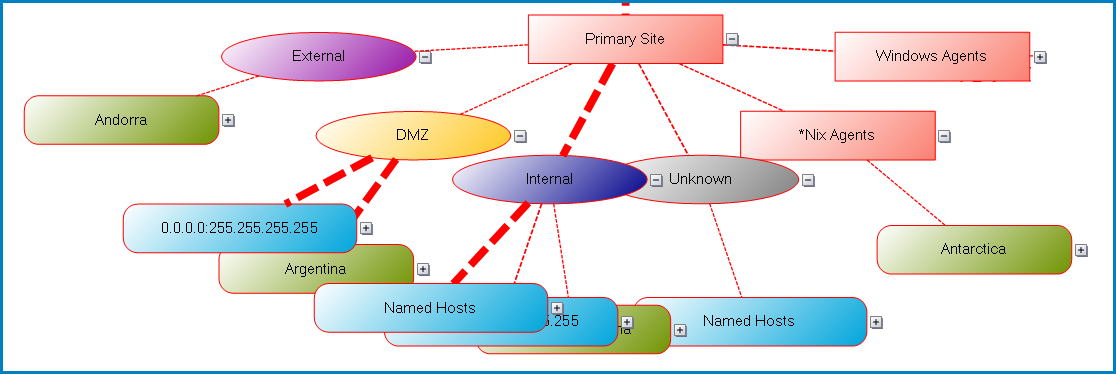
| Network Visualization | This diagram shows the relationship between Hosts in the current set of aggregated logs/events. The right side of the window displays a diagram based on the Investigation results. Only logs that have a source or destination host appear. The left side of the window lists statistics for items selected in the diagram and provides options and controls to modify the view. The diagram features include the following:
For example, in the following diagram where Link Display Mode is set to Logs: Primary Site, Total Log Count = 48,000 logs: Internal node, widest line, Total Log Count = 42,000 logs. Named Hosts, widest line, Total Log Count = 35,000 0.0.0.0:255.255.255.255, medium line, Total Log Count = 6,000 Wallis and Futuna (green field hidden at the bottom), narrowest line, Total Log Count = 1,000
|
Log Viewer Tab
The Log Viewer tab allows you to view individual logs and events and perform other operations on selected logs.
Log Miner
Log Miner is a summary overview and trending tool that is opened after you perform a LogMart Search with Investigator. Log Miner's flexible graphing capabilities make it extremely helpful in understanding your environment's activity for time periods far longer than the time to live (TTL) setting.
Log Miner has five view panes that display data in different ways.
- Log Message Occurrences by Day and Hour of Day. This graph displays each day's logs as a solid shape of a unique color. By viewing the log data by day, in a stack, it is easy to see peak times for log data by looking for the tallest peak stacks in the graph. This pane has the following functionality:
- Hovering over a day selects that shape.
- Hovering over different areas of one day's colored shape displays log counts by hour in the screen tip.
- Double-clicking one day's colored shape causes Log Miner to drill down to that day.
- Log Message Occurrences by Day of Week and Hour of Day. This graph displays each day's logs in a unique color and row, and each hour's logs as a distinct data pillar. By viewing log data by days broken into hours, it is easy to recognize peak days of activity by the row with the highest values, or a peak hour of activity by the tallest pillar. This pane has the following functionality:
- Hovering over a day's colored row highlights that day's row and fade out other days for easier viewing.
- Hovering over different hours of one day's colored row displays log counts by hour in the screen tip.
- Double-clicking one hour's pillar causes Log Miner to drill down to that hour.
- Aggregate Log Messages. This pane gives a detailed view of the aggregate log data being used to generate the graphs. Information on date / time, counts, Common Event, direction, and more are all included.
- Log Message Occurrences by Hour. This graph provides a linear timeline view of the log activity, with each bar representing a particular hour.
- Day of Week and Hour of Day Filter. This pane allows filtering, by days or hours, to be completed very quickly. Select or clear the check boxes in this pane to change filtering.