
Dashboards Page
Dashboards is the first page to display when you log in to the Web Console. It includes the navigation bar, search tools, widgets, a log analysis grid, and a taskbar (all of which are described later in this chapter).
Restricted Analysts and Restricted Administrators do not see the Processing Rate or Trend charts.
You can quickly access the various dashboards used on the Dashboards page to support your different needs (for instructions on switching between different dashboard layouts, see Change Dashboards. In addition to any dashboards that you create, the Dashboards page includes the following predefined dashboard layouts:
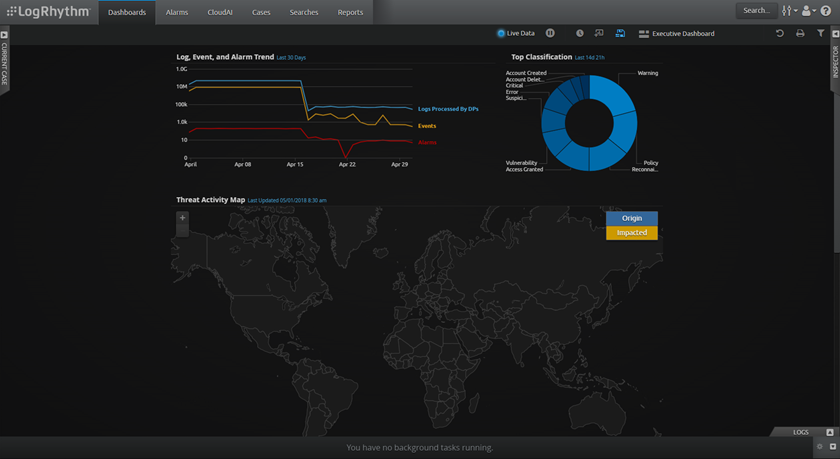
- Executive Dashboard. Designed for management-level users who collect log data, perform real-time analysis and correlate across data, ensure compliance requirements are met, identify high-risk activity, and help manage the incident response process.
- Security Analyst Dashboard. Designed for a security engineer or operations center analyst who monitors the environment for security risks and concerns.
- IT Operations Dashboard. Designed for a system administrator, network administrator, or help desk professional who monitors the environment for IT issues that relate to the availability and health of services or applications delivered to the organization.
For more information on creating and modifying dashboards, see Change Dashboards.