
Current Processing Rate Widgets
The Current Processing Rate widgets are only available to Global Admins or Restricted Admins with elevated View and Manage privileges.
Current Processing Rate widgets display charts representing the processing rates of any one of the following data sets:
- Log Rate (MPS). The messages per second (MPS) rate of log messages processed by the Data Processors Message Processing Engine (MPE).
- AI Engine Rate. The rate of logs processed by the Advanced Intelligence (AI) Engine (provided that an AI Engine has been integrated into your LogRhythm SIEM deployment). Note: The Data may not send a copy of every log to the AI Engine for processing, depending on how the administrator defined the Global Log Processing Rules in the Client Console. Consequently, the AI Engine rate may differ from the log rate.
- Event Rate. The rate of events processed per second in the Log Manager.
- Alarm Rate. The rate of alarms processed per second in the Platform Manager.
- AI Engine Event Rate. The rate of events processed per second in the AI Engine(provided that an AI Engine has been integrated into your LogRhythm SIEM deployment).
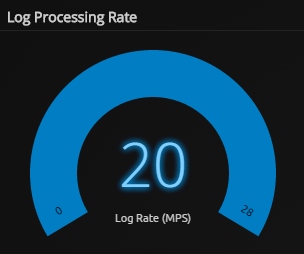
The default chart setting for the Current Processing Rate widget, which can be seen on the predefined Executive Dashboard layout for Global Administrators, shows the log messages per second (MPS) rate of the Data Processor in your deployment. The number in the middle of the chart ("20" in the following example) is the average MPS rate in the last three minutes (excluding the current minute). The smaller numbers on the left and right show the minimum and maximum MPS rates over the last 24 hours.
Review your processing rate charts periodically and observe the volume of data as it is collected, processed, and analyzed. If the numbers are different from what you expect, you should investigate for possible security or operational issues.
To configure Current Processing Rate widgets to show different types of SIEM data sets:
- Hover your mouse over the widget and click the Settings icon.
A blue border appears around the widget and the Inspector panel opens on the right. - In the Inspector panel, do any of the following:
- Click in the Title field and type a new title.
- In the Source field, select one of the following data sets to display on the Current Processing Rate chart.
- Log Rate (MPS)
- AI Engine Rate
- Event Rate
- Alarm Rate
- AI Engine Event Rate
- Click the Save icon on the upper-right side of the page to save the modified widget to your dashboard layout.
- (Optional) Click the arrow to collapse the Inspector panel.