
Work With Network Visualization Diagrams
- Create a new Investigation with Platform Manager or Data Processor as the search type.
- When the results appear, click the Network Visualization tab.
- Do any of the following:
- From the network visualization diagram
Click the + next to nodes to expand them.
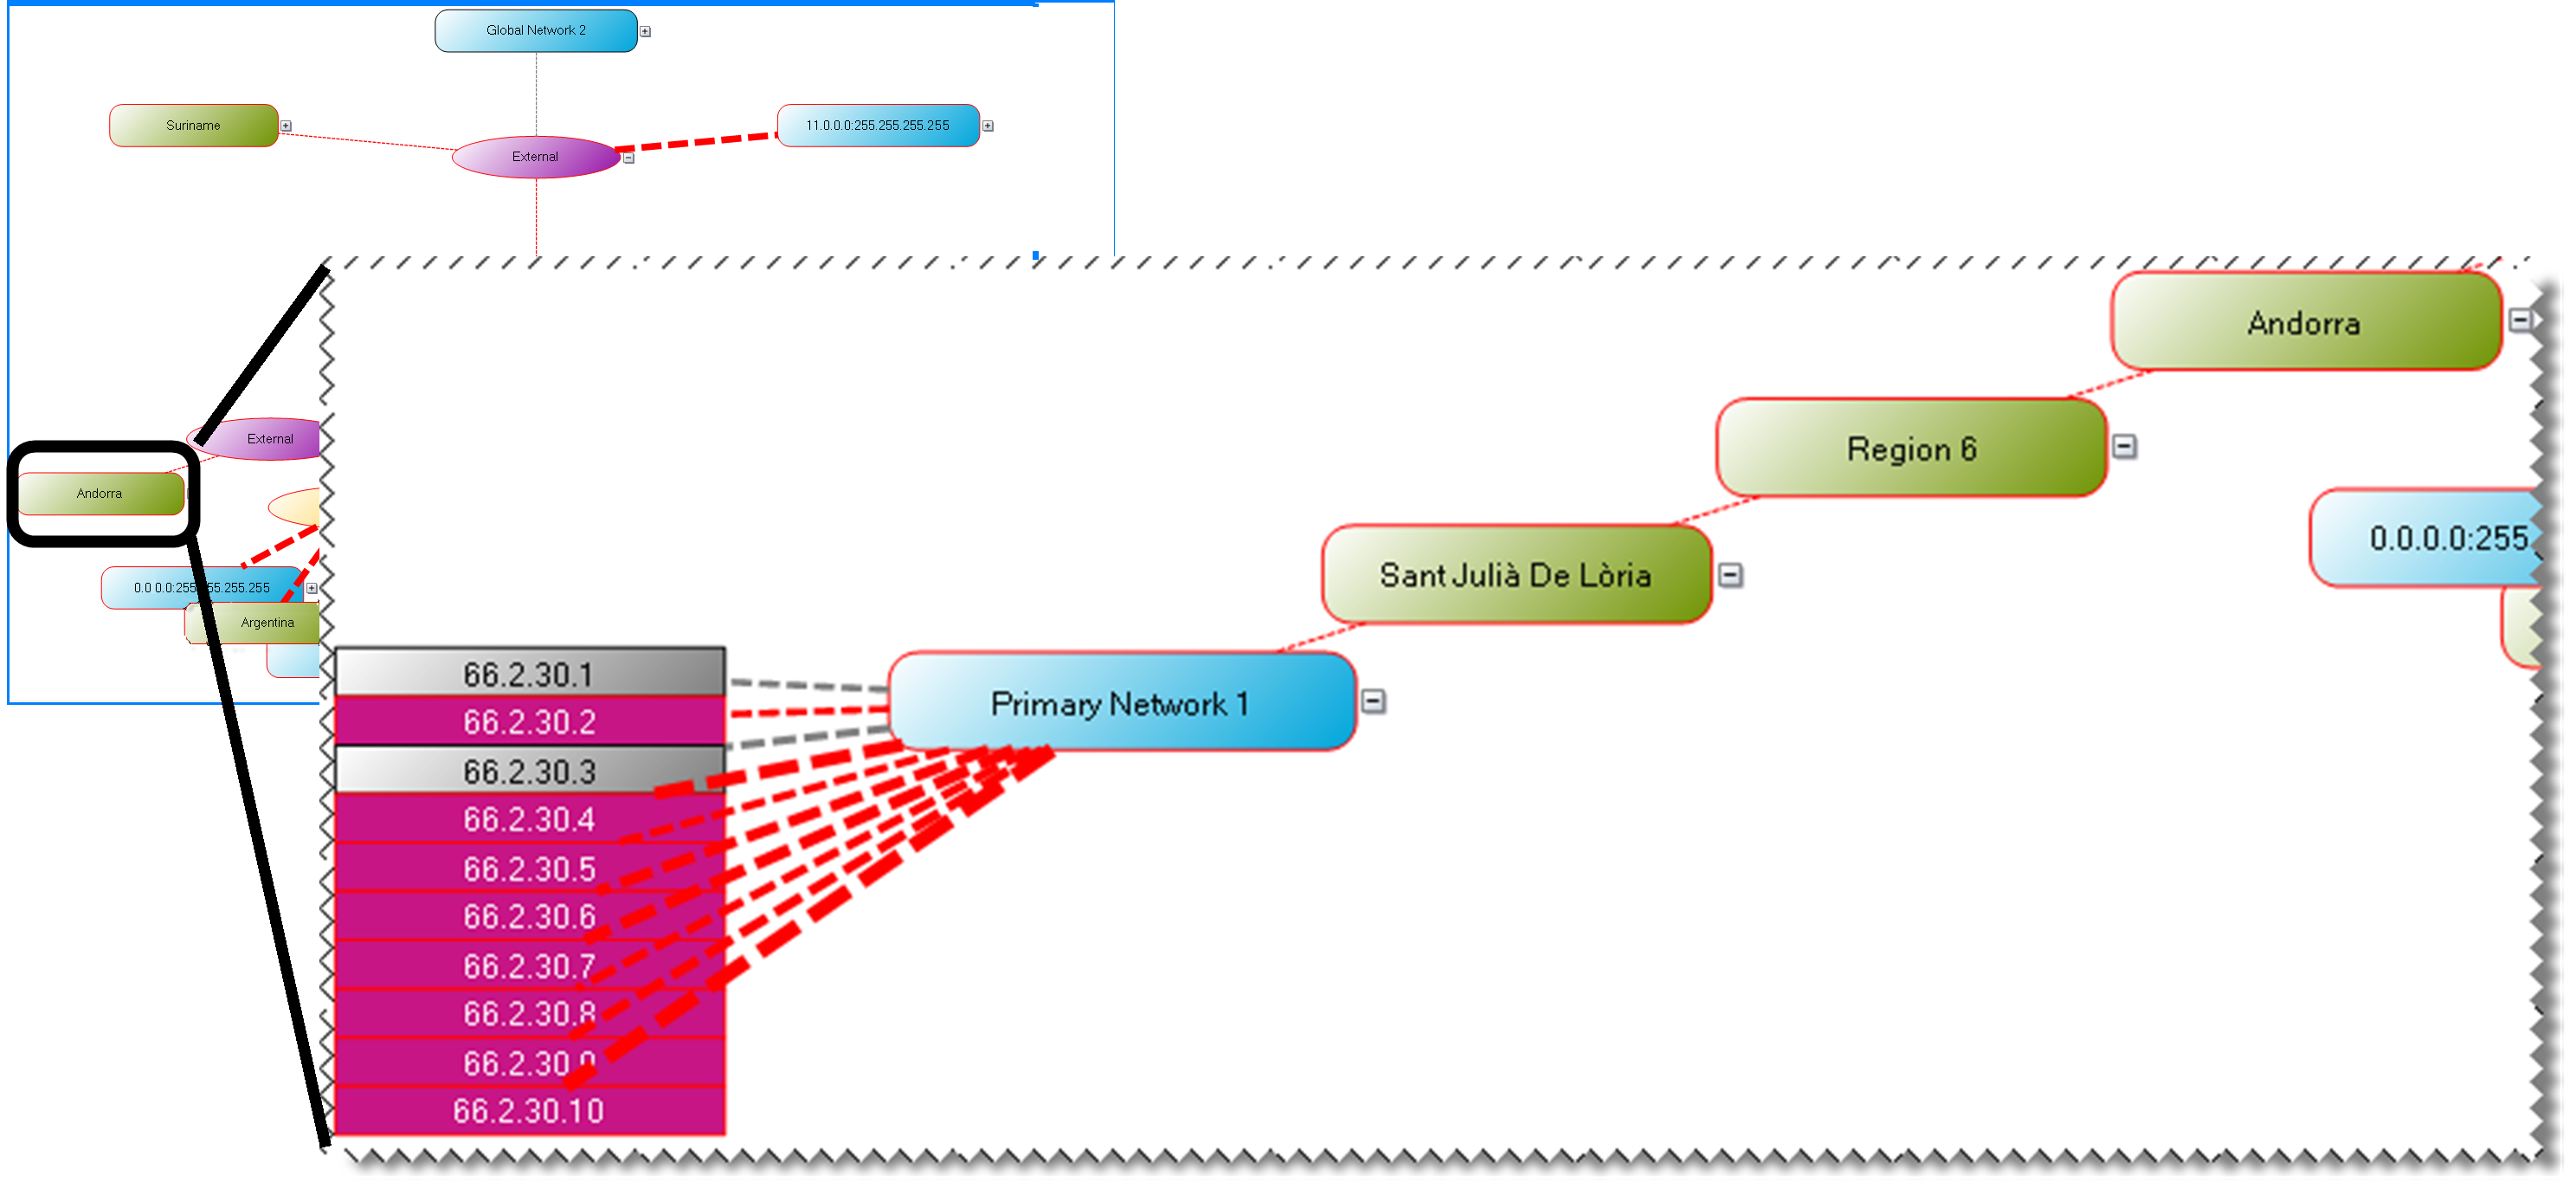
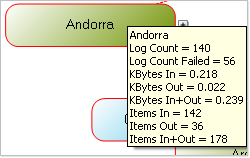
Point to a node to see a screen tip with additional information.
Click a Host to show connections to other Hosts and display detailed information in the left pane.
Arrows at the end of the lines indicate direction.
If a host is both the origin and destination, the line loops back to itself.
Red lines indicate the log failure count is greater than 0.
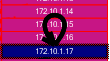
Briefly pause on a link to display a screen tip with statistics about the link.
Press Ctrl and click a link to display its statistics in the left pane.
Double-click a node to drill down and show logs where the node is either the origin or impacted host.
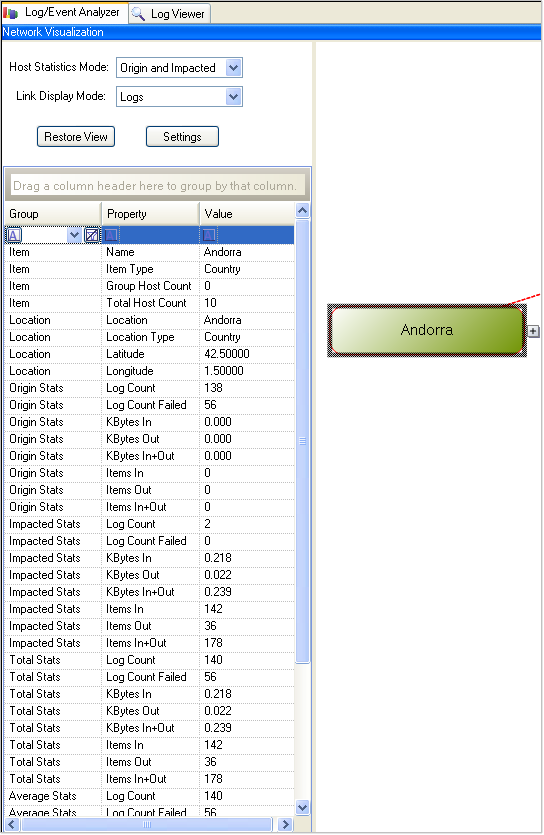
Click a node to view its statistics in the left pane.
Right-click a selected node to display a context menu with the following options:
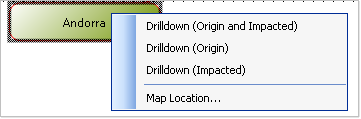
Drilldown (Origin and Impacted). Show logs that have the selected node is the origin or the impacted Host.
Drilldown (Origin). Show logs that have the selected node as the origin Host.
Drilldown (Impacted). Show logs that have the selected node as the impacted Host.
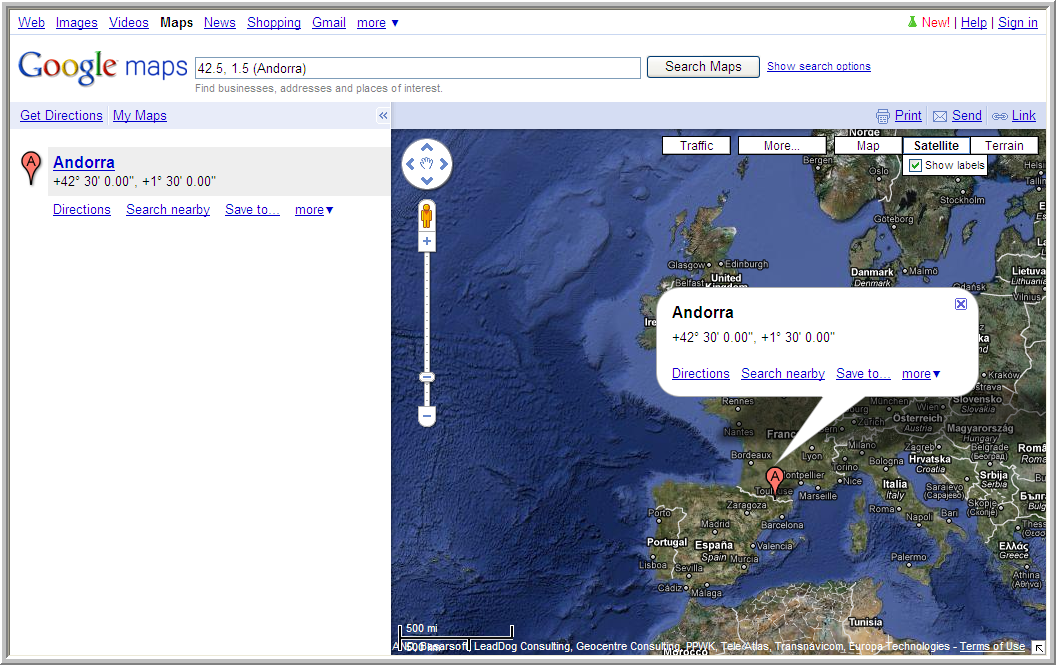
Map Location. If location information is available and you have access to a browser, select this option to display a map of a node location.
- From the left pane of the network visualization tab
- From the top of the left pane
Select a Host Statistics Mode. Set the diagram links and link display mode here. The options are:
Origin and Impacted (default)
Origin
Impacted
Link Display Mode. Set the diagram links and host statistics mode here. The options are:
Logs
Bytes In, or Bytes Out, or Bytes In +Out
Items In, or Items Out, or Items In + Out
Click Restore View to return the diagram to the default view.
Click Settings to display a window where you can:
Select which Group Levels to display.
Select Expand Levels and Zoom to fit in the default view. This setting only affects the default display. You can still expand/contract nodes and modify the zoom in the diagram.
- From the middle of the left pane
- Click a node to select it.
Click the root node to view statistics for the entire diagram.
Click the parent node to view statistics for all related child nodes.
From the bottom of the left pane
Slide the zoom control to increase or decrease the size of the diagram.
Move the rectangle around the thumbnail diagram to select the viewing area.
Click Fit to set the zoom and viewing area to display the entire diagram in one action.
- From the top of the left pane
- From the network visualization diagram