
Data Processing Trend Widgets
Data Processing Trend widgets and their associated charts are only available to Global Admins or Restricted Admins with elevated View and Manage privileges.
Data Processing Trend widgets display charts showing the number trends for logs, events, and/or alarms generated over the last 30-day period. Numbers on the charts can range from one instance to thousands (k) or millions (m) of instances. The charts can be configured to show the specific trends for any or all of the following:
- Alarms. Records of events that triggered an alarm rule.
- Events. Logs that the Data Processor determined to have immediate relevance. This number is an aggregate of Events Forwarded by DPs and Events Forwarded by AI Engines.
- Events Forwarded by AIEs. Logs processed by the AI Engine that triggered an AIE rule (shown only if the AI Engine is integrated in LogRhythm SIEM).
- Events Forwarded by DPs. Logs processed by a Data Processor and identified as an event.
- Logs Processed by DPs. All logs forwarded by agents and processed in a Data Processor. When you select and deselect items, the chart shows the new values in the open editor.
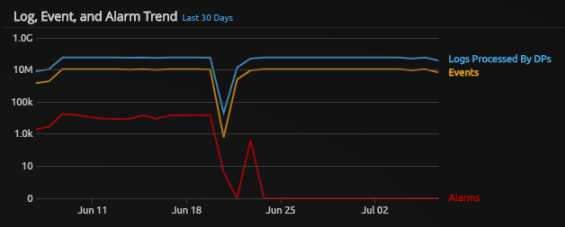
The following graphic shows a Data Processing Trend chart displaying the trends for logs, alarms, and events.
If the Trend chart is difficult to read because of intersecting lines, you can point to the labels to highlight individual trends.
Additionally, you can configure Data Processing Trend widgets to display either Linear or Logarithmic graph scales. Linear graphs are scaled to show absolute values over time, whereas Logarithmic graphs are scaled to show either the rate of change or a skew of multiplicative factors over time. To configure the widget, see Configure Widget Settings.
When viewed on the Analyze page, Data Processing Trend charts show only the filtered data.
To configure Data Processing Trend widgets to show different trends and graph scales:
- Hover your mouse over the widget and click the Settings icon.
A blue border appears around the widget and the Inspector panel opens on the right. - In the Inspector panel, do any of the following:
- Click in the Title field and type a new title.
- In the Show Series field, select the items that you want to display on the trend chart.
- Click the Save icon on the upper-right side of the page to save the modified widget to your dashboard layout.
- (Optional) Click the arrow to collapse the Inspector panel.