
Detailed .zip File Contents From the Diagnostics Tool
All logs, data files, and query results are collected and written to a .zip file in the specified output directory. For example, if the output directory is C:\temp, then the .zip file is named C:\Temp\LogRhythmDiagnostics2_<customer>_<timestamp>, where <customer> is the customer name and <timestamp> is the current timestamp in the format YYYYMMDDHHMMSS.
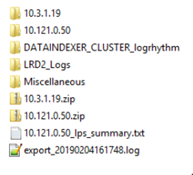
The contents of a LogRhythm Diagnostics Tool Health Check export profile .zip file might look like the following:
Data Indexer Cluster
The DATAINDEXER_CLUSTER_<clustername> folder contains .json files generated from Elasticsearch GET requests. Several Elasticsearch GET requests are sent to each DX to collect information and health status about the Elasticsearch clusters, nodes, and indices. The output is written to the appropriate folder for each DX cluster. Individual Elasticsearch commands are specified in the dxCurlCommands.txt file, located at C:\Program Files\LogRhythm\LogRhythm Diagnostics\config.
ES Component | GET Request | Output File |
Cluster | dxWindows_cluster_settings.json | |
Cluster | dxWindows_cluster_health.json | |
Cluster | dxWindows_cluster_stats.json | |
Cluster | dxWindows_cluster_pending_tasks.json | |
Nodes | dxWindows_nodes_process.json | |
Nodes | dxWindows_nodes_stats.json | |
Nodes | dxWindows_nodes_hot_threads.json | |
Indexes | dxWindows_cat_master.json | |
Indexes | dxWindows_cat_nodes.json | |
Indexes | dxWindows_cat_indices.json | |
Indexes | dxWindows_cat_shards.json |
LRD2_Logs
The LRD2_Logs folder contains the LogRhythm Diagnostics Tool’s application log and LogRhythmDiagnostic.log.
Export Log
The data collection log file for the LogRhythm Diagnostics Tool itself is written to the root of the .zip folder as export_<datastamp>.log.
Diagnostics Tool LogRhythm Logs
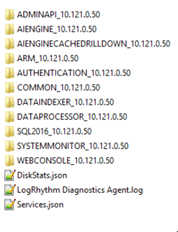
By default, both the Health Check and Logs Export profiles collect LogRhythm component logs (AI Engine, Data Processor, Alarming and Response Manager, System Monitor, and Web Console). These logs are in the export .zip file within a nested .zip for each node in the deployment. For example, in the export .zip below, the 10.121.0.50.zip file would contain the LogRhythm logs for the 10.121.0.50 node. The export also includes a folder, LRD2_Logs, with the LogRhythm Diagnostics client log. The LogRhythm Diagnostics Agent’s log is included within each individual node’s .zip file. Disk statistics and LogRhythm service information is also included.
Miscellaneous
Deployment Topology
This query returns the LogRhythm deployment topology based on information pulled from the PM’s EMDB. Each LogRhythm component is represented: Platform Manager, Data Processors, Data Indexers, AI Engines, and Web Consoles. Query results are written in .csv format to the Miscellaneous folder with the file name topologyInfo<date>.csv, where <date> is in the current date in the format YYYYMMDD (for example, topologyInfo20171103.csv). The .csv result file has the following columns:
- COMPONENT
- MODEL
- HOST
- IP
- LICENSED RATE
- ARCHIVING RATE
- PROCESSING RATE
- INDEXING RATE
- EVENT RATE
- LOGMART RATE
DX Cluster Topology
This query returns the DX cluster topology (clusters and nodes) based on information pulled from the PM’s EMDB. Query results are written in .csv format to the Miscellaneous folder with the file name dxclusters.csv. The .csv result file has the following columns:
- ClusterName
- Status
- LastHeartbeat
- NodeName
- HeapUsed
- PercentageDiskUsed
- NumberOfActiveIndexes
- NumberOfArchiveIndexes
- NumberOfIndexLogsLastHour
Version Data
All the deployment-wide versions are written to the Miscellaneous folder with the file name version_data.txt. The following version information is collected:
- LogRhythm License ID and Licensee
- LogRhythm Database Versions
- LogRhythm Component Versions
- Knowledge Base Version
- Knowledge Base Module Versions
- SQL Server Version
LogRhythm Service Status
All LogRhythm services on each appliance are queried to determine their status. The data is written to the component’s folder to a file called Services.json. The .json result file has the following fields:
- displayName
- installed
- logFiles
- serviceName
- status
Log Source Type Counts
This query returns the all the log sources in the deployment grouped by log source type. Query results are written in .csv format to the Miscellaneous folder with the file name logsourcetype_counts.csv. The .csv result file has the following columns:
- MsgSourceTypeID
- MsgSourceTypeName
- NumberSources
AI Engine Data Files
When the AI Engine backs up and falls behind processing, a symptom is a large collection of unprocessed data files in the AI Engine’s data directory. This query returns the number and size of the files in AIE’s data, dataread, and dataerror directories. Query results are written in .csv format to the AIE folder for each AI Engine in the deployment with the file name <IP>_datafiles.csv, where <IP> is the IP address of the AI Engine host. The .csv result file has the following columns:
- NUMDATAFILES
- SIZEDATAFILES
- NUMDATAREADFILES
- SIZEDATAREADFILES
- NUMDATAERRORFILES
- SIZEDATAERRORFILES
For the AI Engine, the following log files are collected:
- Common Components
- HostInference_Purge
- HostInference_Retire
- LRAIEComMgr
- LRAIEngine
- System Monitor Agent (scsm)
Data Indexer
Linux and Windows
For the Data Indexer, the following log files are collected:
- Common Components (API Gateway, Authentication, Service Registry)
- allconf
- anubis
- bulldozer
- carpenter
- columbo
- configserver
- denorm
- fermi
- godispatch
- heartthrob
- lr-allconf-stderr
- lr-allconf-stdout
- lr-anubis-stderr
- lr-anubis-stdout
- lr-bulldozer-stderr
- lr-bulldozer-stdout
- lr-capenter-stderr
- lr-capenter-stdout
- lr-columbo-stderr
- lr-columbo-stdout
- lr-configserver-stderr
- lr-configserver-stdout
- lr-consul-template-stderr
- lr-consul-template-stdour
- lr-denorm-stderr
- lr-denorm-stdout
- lr-godispatch-stderr
- lr-godispatch-stdout
- lr-grafana-stderr
- lr-grafana-stdout
- lr-heartthrob-stderr
- lr-heartthrob-stdout
- lr-influxdb-stderr
- lr-influxdx-stdout
- lr-spawn-stderr
- lr-spawn-stdout
- lr-transporter-stderr
- lr-transporter-stdout
- lr-watchtower-stderr
- lr-watchtower-stdout
- mergeforward
- spawn
- transporter
- unicon
- upgradechecker
- watchtower
- System Monitor Agent (scsm)
Data Processor
For the Data Processor, the following log files are collected:
- archive
- badmsgsourceid
- evtmsgprocessor
- ldsengine
- lps_detail
- lps_detail_snapshot
- lraiedp
- scmedsvr
- scmpe
- scmpedns
- System Monitor Agent (scsm)
Oversubscription Analysis
The following oversubscription/capacity report captures data from the Utilization page and is written to the capacity_analysis.txt file in the base directory of the .zip file:
Deployment Capacity Report
Report Generated 3/27/2018 4:47:32 PM
*** All rates are in messages per second (MPS) ***
=====
Platform Manager: Event, LogMart, and Alarm Rates
=====
Host (IP): SANNESPM (10.4.2.46)
Model: LR-XM8400 Series
Event Rates
Max Sustained: 200
Max Peak: 300
Last Hour: 0
Last Day: 0
Last Week: 0
Logmart Rates
Max Sustained: 200
Max Peak: 300
Last Hour: 21
Last Day: 21
Last Week: 21
Alarm Rates
Last Hour: 0
Last Day: 0
Last Week: 0
=====
Data Processors: Processing and Archiving Rates
=====
Processing Rates
Host (IP) Model Licensed Max Sustained Max Peak Last Last Last
Rate Rate Rate Hour Day Week
--------- ----- -------- ------------- -------- ---- ---- ----
SANNESPM (10.4.2.46) LR-XM8400 Series 5000 10000 15000 99 99 99
LRDP-02 (10.4.3.47) LR-DPX7400 Series5000 15000 22500 0 0 0
Indexing Rates
Host (IP) Model Last Last Last
Hour Day Week
--------- ----- ---- ---- ----
SANNESPM (10.4.2.46) LR-XM8400 Series 33 33 33
LRDP-02 (10.4.3.47) LR-DPX7400 Series 0 0 0
Archiving Rates
Host (IP) Model Max Sustained Max Peak Last Last Last
Rate Rate Hour Day Week
--------- ----- ------------- -------- ---- ---- ----
SANNESPM (10.4.2.46) LR-XM8400 Series 40000 60000 99 99 99
LRDP-02 (10.4.3.47) LR-DPX7400 Series 50000 75000 0 0 0
=====
Data Indexers: Indexing Rates
=====
Host (IP) Model Max Sustained Max Peak Last Last Last
Rate Rate Hour Day Week
--------- ----- ------------- -------- ---- ---- ----
SANNESPM (10.4.2.46) Unknown 10000 15000 0 0 0
****************************************
** Hours Over Maximum Sustained Rates **
****************************************
Platform Manager Event Rate
Host (IP) Last Day Last 7 Days Last 30 Days
--------- -------- ----------- ------------
SANNESPM (10.4.2.46) 0 0 845
Platform Manager Logmart Rate
Host (IP) Last Day Last 7 Days Last 30 Days
--------- -------- ----------- ------------
SANNESPM (10.4.2.46) 0 0 407
Data Processor Processing Rate
Host (IP) Last Day Last 7 Days Last 30 Days
--------- -------- ----------- ------------
SANNESPM (10.4.2.46) 0 0 241
LRDP-02 (10.4.3.47) 0 0 51
Data Processor Archiving Rate
Host (IP) Last Day Last 7 Days Last 30 Days
--------- -------- ----------- ------------
SANNESPM (10.4.2.46) 0 0 0
LRDP-02 (10.4.3.47) 0 0 0
Data Processor Indexing Rate
Host (IP) Last Day Last 7 Days Last 30 Days
--------- -------- ----------- ------------
SANNESPM (10.4.2.46) 0 0 0
LRDP-02 (10.4.3.47) 0 0 0
*************************************
** Minutes Over Maximum Peak Rates **
*************************************
Platform Manager Event Rate
Host (IP) Last Day Last 7 Days Last 30 Days
--------- -------- ----------- ------------
SANNESPM (10.4.2.46) 0 0 0
Platform Manager Logmart Rate
Host (IP) Last Day Last 7 Days Last 30 Days
--------- -------- ----------- ------------
SANNESPM (10.4.2.46) 0 0 0
Data Processor Processing Rate
Host (IP) Last Day Last 7 Days Last 30 Days
--------- -------- ----------- ------------
SANNESPM (10.4.2.46) 0 0 0
LRDP-02 (10.4.3.47) 0 0 0
Data Processor Archiving Rate
Host (IP) Last Day Last 7 Days Last 30 Days
--------- -------- ----------- ------------
SANNESPM (10.4.2.46) 0 0 0
LRDP-02 (10.4.3.47) 0 0 0
Data Processor Indexing Rate
Host (IP) Last Day Last 7 Days Last 30 Days
--------- -------- ----------- ------------
SANNESPM (10.4.2.46) 0 0 0
LRDP-02 (10.4.3.47) 0 0 0
Log Volume Analysis
The following LogMart log volume queries show log volume by Deployment, Data Processor, Log Source Type, and Log Source.
Deployment and Data Processor Log Volume
The following LogMart log volume queries are grouped by Data Processor (Mediator) for the previous one hour and 24 hours. There are also log volume queries by Development and DP for the previous 30 days. All files are written to the Miscellaneous folder.
Processed Logs by Mediator
Files (.csv): processed_logs_by_mediator_1hr.csv, processed_logs_by_mediator_24hrs.csv
This query shows log volumes and processing rates for each Data Processor (Mediator) for the previous one hour and 24 hours. The .csv result files have the following columns:
- MediatorID, Name, TotalLogsProcessedLast1Hour, AvgLogsProcessedPerSecondLast1Hour
- MediatorID, Name, TotalLogsProcessedLast24Hours, AvgLogsProcessedPerSecondLast24Hours
Indexed Logs by Mediator
Files (.csv): indexed_logs_by_mediator_1hr.csv, indexed_logs_by_mediator_24hrs.csv
This query shows log volumes and indexing rates for each Data Processor (Mediator) for the previous one hour and 24 hours. The .csv result files have the following columns:
- MediatorID, Name, TotalLogsIndexedLast1Hour, AvgLogsIndexedPerSecondLast1Hour
- MediatorID, Name, TotalLogsIndexedLast24Hours, AvgLogsIndexedPerSecondLast24Hours
LogMart Mediator Stats by Hour – Last 30 Days
File (.csv): statsMediatorCountsHour20171103.csv
This query shows hourly log processing rates for each Data Processor (Mediator) for the previous 30 days. The .csv result files have the following columns:
- StatDate
- MediatorID
- CountLogs
- CountProcessedLogs
- CountIdentitfiedLogs
- CountArchivedLogs
- CountOnlineLogs
- CountDeduplicatedLogs
- CountEvents
- CountEventsForwarded
- EventsRBPSum
- EventsForwardedRBPSum
- CountLogMart
- CountEventsAIEngine
- CountAlarms
- CountAIEngineRPBSum
- CountAnalyzedLogs
LogMart Deployment Stats by Hour – Last 30 Days
File (.csv): statsDeploymentCountsHour20171103.csv
This query shows hourly log processing rates for the deployment for the previous 30 days. The .csv result files have the following columns:
- StatDate
- CountLogs
- CountProcessedLogs
- CountIdentitfiedLogs
- CountArchivedLogs
- CountOnlineLogs
- CountDeduplicatedLogs
- CountEvents
- CountEventsForwarded
- EventsRBPSum
- EventsForwardedRBPSum
- CountLogMart
- CountEventsAIEngine CountAlarms
- CountAIEngineRPBSum
- CountAnalyzedLogs
Log Source Type and Log Source Log Volume – Processed and Indexed
The following LogMart log volume queries are grouped by log source type and log source for the previous one hour and 24 hours. All files are written to the Miscellaneous folder.
Processed Logs by Log Source Type
Files (.csv): processed_logs_by_msgsourcetype_1hr.csv, processed_logs_by_msgsourcetype_24hrs.csv
This query shows log volumes and processing rates for each log source type for the previous one hour and 24 hours. The .csv result files have the following columns:
- MsgSourceTypeID, Name, TotalLogsProcessedLast1Hour, AvgLogsProcessedPerSecondLast1Hour
- MsgSourceTypeID, Name, TotalLogsProcessedLast24Hours, AvgLogsProcessedPerSecondLast24Hours
Processed Logs: Top 100 Noisy Log Sources
Files (.csv): top100_processed_logs_by_msgsource_1hr.csv, top100_processed_logs_by_msgsource_24hrs.csv
This query shows log volumes and processing rates for the Top 100 (by processing rate) log sources for the previous one hour and 24 hours. The .csv result files have the following columns:
- MsgSourceID, Name, TotalLogsProcessedLast1Hour, AvgLogsProcessedPerSecondLast1Hour
- MsgSourceID, Name, TotalLogsProcessedLast24Hours, AvgLogsProcessedPerSecondLast24Hours
Processed Logs: Bottom 100 Noisy Log Sources (aka Quiet Logs Sources)
Files (.csv): bottom100_processed_logs_by_msgsource_1hr.csv, bottom100_processed_logs_by_msgsource_24hrs.csv
This query shows log volumes and processing rates for the Bottom 100 (by processing rate) log sources for the previous one hour and 24 hours. The .csv result files have the following columns:
- MsgSourceID, Name, TotalLogsProcessedLast1Hour, AvgLogsProcessedPerSecondLast1Hour
- MsgSourceID, Name, TotalLogsProcessedLast24Hours, AvgLogsProcessedPerSecondLast24Hours
Indexed Logs by Log Source Type
Files (.csv): indexed_logs_by_msgsourcetype_1hr.csv, indexed_logs_by_msgsourcetype_24hrs.csv
This query shows log volumes and indexing rates for each log source type for the previous one hour and 24 hours. The .csv result files have the following columns:
- MsgSourceTypeID, Name, TotalLogsIndexedLast1Hour, AvgLogsIndexedPerSecondLast1Hour
- MsgSourceTypeID, Name, TotalLogsIndexedLast24Hours, AvgLogsIndexedPerSecondLast24Hours
Indexed Logs: Top 100 Noisy Log Sources
Files (.csv): top100_indexed_logs_by_msgsource_1hr.csv, top100_indexed_logs_by_msgsource_24hrs.csv
This query shows log volumes and indexing rates for the Top 100 (by indexing rate) log sources for the previous one hour and 24 hours. The .csv result files have the following columns:
- MsgSourceID, Name, TotalLogsIndexedLast1Hour, AvgLogsIndexedPerSecondLast1Hour
- MsgSourceID, Name, TotalLogsIndexedLast24Hours, AvgLogsIndexedPerSecondLast24Hours
Indexed Logs: Bottom 100 Noisy Log Sources (aka Quiet Logs Sources)
Files (.csv): bottom100_processed_logs_by_msgsource_1hr.csv, bottom100_processed_logs_by_msgsource_24hrs.csv
This query shows log volumes and indexing rates for the Bottom 100 (by indexing rate) log sources for the previous one hour and 24 hours. The .csv result files have the following columns:
- MsgSourceID, Name, TotalLogsIndexedLast1Hour, AvgLogsIndexedPerSecondLast1Hour
- MsgSourceID, Name, TotalLogsIndexedLast24Hours, AvgLogsIndexedPerSecondLast24Hours
LogRhythm SQL Server Databases
SQL Server Databases
All LogRhythm database information is written to the Miscellaneous folder with the file name sqlversion_data.txt. The .csv result file has the following columns:
- Name
- PhysicalName
- SizeMB
- GrowSizeMB
- MaxSizeMB
- Version
- LastBackup
SQL Server Job History (LogRhythm Maintenace Jobs)
This query returns the history and status of the LogRhythm Maintenance Jobs in SQL Server. Query results are written in .csv format to the Miscellaneous folder with the file name mssqlJobHistory<date>.csv, where <date> is in the current date in the format YYYYMMDD (for example, mssqlJobHistory20171103.csv). The .csv result file has the following columns:
- NAME
- RUN_DATE
- RUN_STATUS
- RUN_DURATION
- MESSAGE
Enabled AIE Rules (and Performance Metrics), Alarms, and GLPRs
Enabled AIE Rules and Performance Metrics
This EMDB query shows all enabled AIE rules, their status, Alarm status, and performance metrics such as runtime cost, shared/unshared memory cost/bytes, recent events forwarded count/minutes, and recent events feedback count/minutes. Query results are written in .csv format to the Miscellaneous folder with the file name enabledaieruleperf.csv. The .csv result file has the following columns:
- AIERuleID
- Name
- DateUpdated
- AlarmEnabled
- SuspendReason
- RuntimeCost
- UnsharedMemoryCost
- UnsharedMemoryBytes
- SharedMemoryCost
- SharedMemoryBytes
- RecentEventForwardedCount
- RecentEventForwardedMinutes
- RecentEventFeedbackCount
- RecentEventFeedbackMinutes
Enabled Alarm Rules
This EMDB query shows all enabled Alarm rules and their status. Query results are written in .csv format to the Miscellaneous folder with the file name enabledalarmrules.csv. The .csv result file has the following columns:
- AlarmRuleID
- AlarmType
- ParentAlarmRuleID
- HostCriteriaType
- Name
- PriorityFilter
- DateUpdated
- SuppressTime
- Version
- AlarmRuleGroup
- DataSegregationMode
- RunActions
Enabled Global Log Processing Rules (GLPRs)
This EMDB query shows all enabled GLPRs and their status. Query results are written in .csv format to the Miscellaneous folder with the file name enabledglprs.csv. The .csv result file has the following columns:
- GlobalLogProcessingRuleID
- Name
- SortOrder
- DateUpdated
- DateExpires
LogRhythm Diagnostic Alarms – Last 24 Hours
This Alarms DB query shows the previous 1,000 Diagnostic Alarms in the past 24 hours. Query results are written in .csv format to the Miscellaneous folder with the file name lrdiagnosticalarms.csv. The .csv result file has the following columns:
- AlarmID
- Entity
- AlarmDate
- Status
- Name
- LastPerson
Performance Counters
Each LogRhythm Component has its Performance Counters collected and stored in the component’s folder. Counters are written in .csv format to the appropriate component folder with the file name <component name>_perfmon.csv.
All Component Hosts
For each host running a LogRhythm component, the following counters are collected:
AI Engine
The following performance counters are collected for each AI Engine in the deployment:
LogRhythm AI Engine Communication Manager
- Connected LMs
- Rate Data Flushed / Sec
- Rate Data Received / Sec
- Total # of Data Files
- Total Data Flushed
- Total Data Received
LogRhythm AI Engine Server
- # Event Insert DB Retires
- # of Data Files Deleted
- # of Disabled Rules
- # of Enabled Rules
- Current # of Data Files
- Data Files Deleted / Sec
- Log Messages Processed / Sec
- Log Messages Received / Sec
Data Processor
The following performance counters are collected for each Data Processor in the deployment:
LogRhythm AI Engine Data Provider
Data Queue Size (KB)
Rate Logs Flushed / Sec
Total Logs Flushed
LogRhythm Mediator:LDS
# Active Distribution Engines
# Loaded LDS Policies
# Loaded LDS Receivers
# Logs Dropped
# Logs in Unprocessed Queue
# Logs Processed
# Logs Processed / Sec
# Logs Queued for Distribution
# Processing Errors
LogRhythm Mediator:LogMart
% Full LogMart Heap
% Full UniqueLog Collection
Log Commit Count
Log Forwarding Rate
UniqueLog Hit %
UniqueLogStat Hit %
LogRhythm Mediator:Processing
% Full Address Cache
% Full Archive Queue
% Full Command Cache
% Full Domain Cache
% Full Group Cache
% Full Hostname Cache
% Full Interface Cache
% Full Log Processing Queue
% Full MAC Address Cache
% Full Msg Aggregation Cache
% Full Object Cache
% Full Process Cache
% Full Severity Cache
% Full UC100 Cache
% Full UC1000 Cache
% Full UC255 Cache
% Full UC50 Cache
% Full URL Cache
% Full User Cache
% Full Version Cache
% Full CMID Cache
EMIM % Full Disk Insert Queue
EMIM % Full Realtime Insert Queue
EMIM Current Spooled Files
EMIM Current Spooled Logs
EMIM Disk Insert Queue Size
EMIM Insert Table Row Count
EMIM Logs Dequeued From Disk Queue
EMIM Logs Dequeued From Realtime Queue
EMIM Logs Inserted In Batch
EMIM Logs Processed By Insert Manager
EMIM Overall Insert Rate
EMIM Realtime Dequeue %
EMIM Realtime Insert Queue Size
EMIM Total Logs Inserted
EMIM Total Spooled Files
EMIM Total Spooled Logs
GLPRs Enabled
GLPRs Hit %
GLPRs Processing Rate
Intelligent Indexing Data Processor & Indexer % Indexed
Intelligent Indexing LogMart % Indexed
Intelligent Indexing Processing Rate
IPToName DNS Avg. Resolution Time
IPToName DNS Hit %
Logs Archived to Disk / Sec
Logs Archived to Memory / Sec
Queue Count Archive
Queue Count Archive Sealing
Queue Count Processed Logs
Queue Count Unprocessed Logs
Rate Events Inserted / Sec
Rate Logs Processed / Sec
Rate Logs Received / Sec
LogRhythm Mediator:Stats
# Agent Connections
# Connected Message Sources
# Disabled Rules
# Event Insert DB Retires
# Logs Archived
# Logs Forwarded
# Logs Identified
# Logs Not Processed
# Logs Processed
# Logs Received
# Unprocessed Archive Logs
% Logs Forwarded
% Logs Identified
% Time in Maintenance
LogRhythm Messaging
# Acks Received
# batched logs/sec
# bytes/sec
# Messages Awaiting Serialization
# Messages Enqueued
# Messages Sent
# Messages Sent over Transport
# Messages Serialized
# Messages Waiting for Ack
# Messages Written to Disk
Average Ack Latency
Rate Acks Received
Rate Messages Enqueued
Rate Messages Sent
Rate Messages Sent over Transport
Rate Messages Serialized
Transport Errors since subsystem start
Platform Manager
The following performance counters are collected from the Platform Manager:
LogRhythm ARM
# Alarm Insert DB Retries
# Alarms Processed
# ePO Notifications Processed
# Events Processed
# Failed SMTP Notifications
# Failed SNMP Notifications
# Notification Logs Processed
# Notifications Processed
# SmartResponseTM Processed
# SMTP Notifications Sent
# SNMP Notifications Sent
# Text Notifications Processed
% Realtime
Alarm Rule Hit %
Queue Count Alarms
Queue Count ePO Notifications
Queue Count Notification Logs
Queue Count Notifications
Queue Count SmartResponseTM
Queue Count SMTP
Queue Count SNMP
Queue Count Text Notifications
Rate Alarms Processed
Rate ePO Notifications Processed
Rate Events Processed
Rate Notification Logs Processed
Rate Notifications Processed
Rate SmartResponseTM Processed
Rate SMTP Notifications Sent
Rate SNMP Notifications Sent
Rate Text Notifications Process