The section describes how the Open Collector works with Event Hub using the example use case of adding a Network Security Group Rule.
The Validation component of each step provides instructions for confirming that a log source made it to the correct location.
-
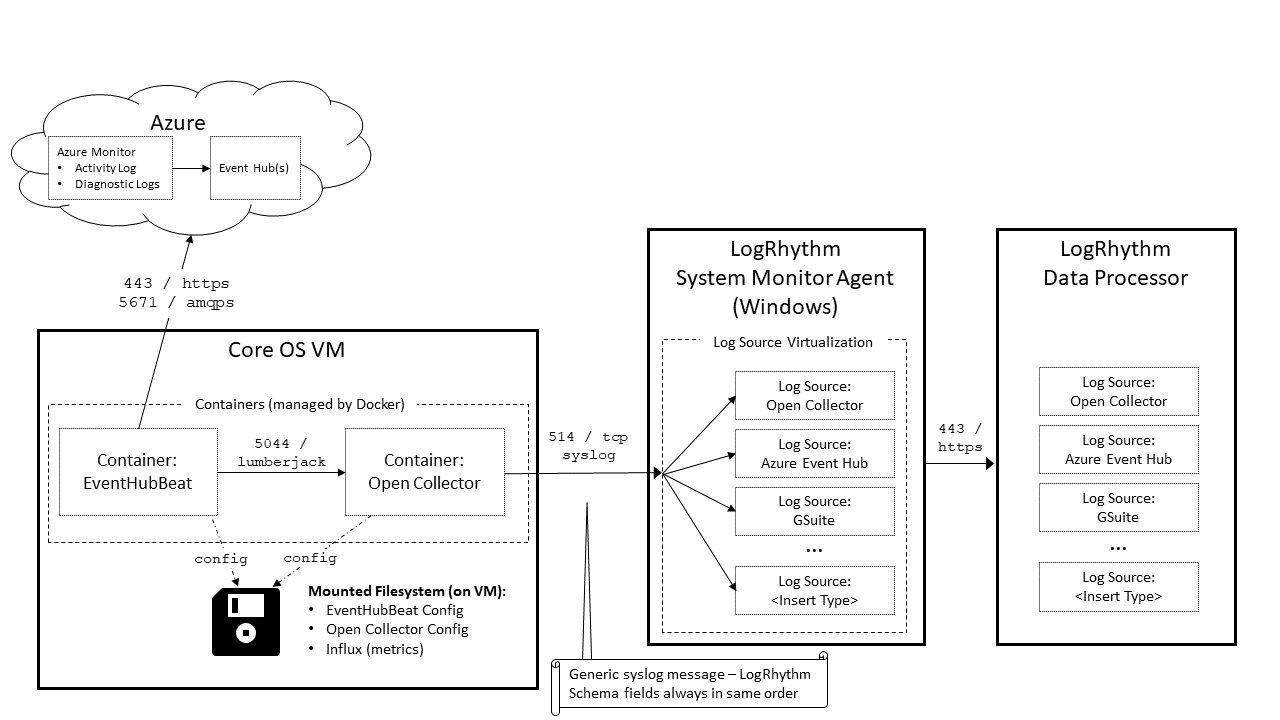
The end user creates a Network Security Group Rule in the Azure Portal.
In the background, the Azure Portal calls an API. This API call generates the Activity Log. -
The NSG Rule Log is created in Azure Monitor's Activity Log.
Validation:
-
In the Azure Portal, on the left menu, click Monitor.
-
Click Activity Log.
-
-
The Log is streamed to the Event Hub (insights-operational-logs).
Validation:-
In the Azure Portal, open the Event Hub Namespace the end user configured logs to export to.
-
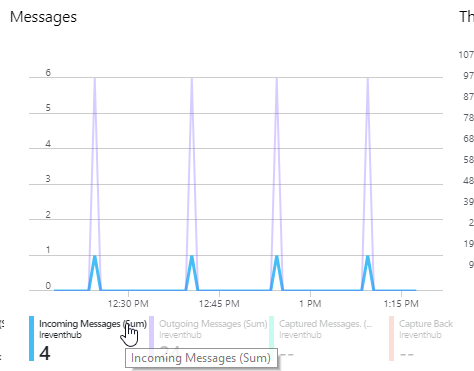
Open the insights-operational-logs Event Hub.
-
In the Messages metrics graph, you should see Incoming Messages, which indicate that logs are getting into the Event Hub.
-
-
-
The EventHubBeat queries the Event Hub and gets the Log.
Validation:
Option 1. In the Messages metrics graph, look for Outgoing Messages, which indicate the Beat is successfully getting messages from the Event Hub.
Option 2. In the EventHubBeat logs, look for the metrics in the log file.-
Use the following command:
./lrctl ehb logs | grep "Number of records received"
-
View the log. For example:
2019-03-21T09:56:09.490-0600 INFO publisher/azurehubconsumer.go:281 Number of records received for EventHub Instance insights-operational-logs: 12
If you receive errors from the Event Hub Beat logs, see
Troubleshoot Azure and Event Hubs
.
-
-
The EventHubBeat sends the log to the Open Collector.
Validation: Open Grafana and look at the Input graphs in the left column of the default dashboard. For more information, see the Grafana topic in the Open Collector Installation and User Guide. -
The Open Collector normalizes the Log to the LogRhythm Schema.
The Machine Data Intelligence (MDI)—mapping the JSON fields to the LogRhythm Schema—happens here.
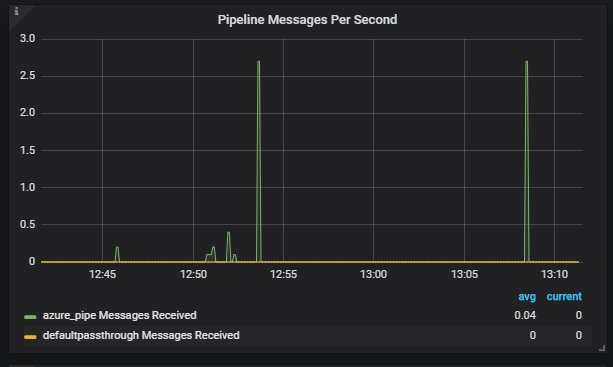
Validation: To ensure that logs match the Azure MDI, open Grafana and look at the Pipeline graphs in the middle column of the default dashboard. For more information, see the View Open Collector Metrics via Grafana topic in the Open Collector Installation and User Guide.-
All Azure logs should match
azure_pipe. None should hitdefaultpassthrough. -
There is also a graph for Pipeline Errors. There should be no errors here. If you find any, open a support ticket so they can escalate the case to engineering, if necessary. For more information, see the troubleshooting sections.
-
-
The Open Collector sends the Log to the Windows System Monitor Agent over syslog. The Open Collector sends a consistently formatted syslog feed. By default, this is TCP.
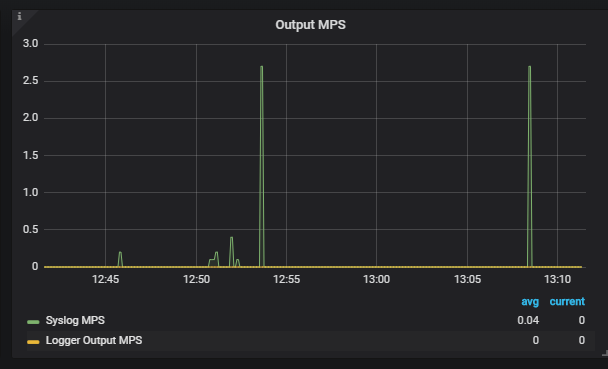
Validation: Open Grafana and look at the Output graphs in the right column of the default dashboard. For more information, see the Grafana topic in the Open Collector Installation and User Guide.
If Grafana indicates any syslog errors, ensure that ports are open correctly and the System Monitor Agent is healthy.
-
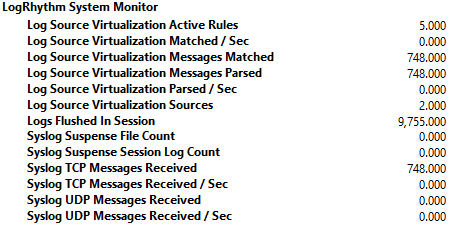
The System Monitor Agent uses Log Source Virtualization to split the generic Open Collector syslog stream into more accurate Log Source Types, which are sent to the Data Processor.
Validation: Using Performance Counters, ensure that syslog reaches the Agent. The Open Collector defaults to TCP syslog.
-
The Data Processor uses generic regex in an MPE Base Rule to extract the syslog information
-
This regex can handle any LogRhythm field, as long as it is in the correct order, which the Open Collector syslog sender guarantees.
-
A field/value pair will only be present in the log if the field has a value.
-
Classification/Common Event assignment is still done with Sub Rules in the Data Processor.
For more information on MPE rules, see the Message Processing Engine Rule Builder topic in the LogRhythm SIEM Help.
-